Potawatomi vs South American Indian Median Household Income
COMPARE
Potawatomi
South American Indian
Median Household Income
Median Household Income Comparison
Potawatomi
South American Indians
$72,576
MEDIAN HOUSEHOLD INCOME
0.0/ 100
METRIC RATING
306th/ 347
METRIC RANK
$87,446
MEDIAN HOUSEHOLD INCOME
81.8/ 100
METRIC RATING
147th/ 347
METRIC RANK
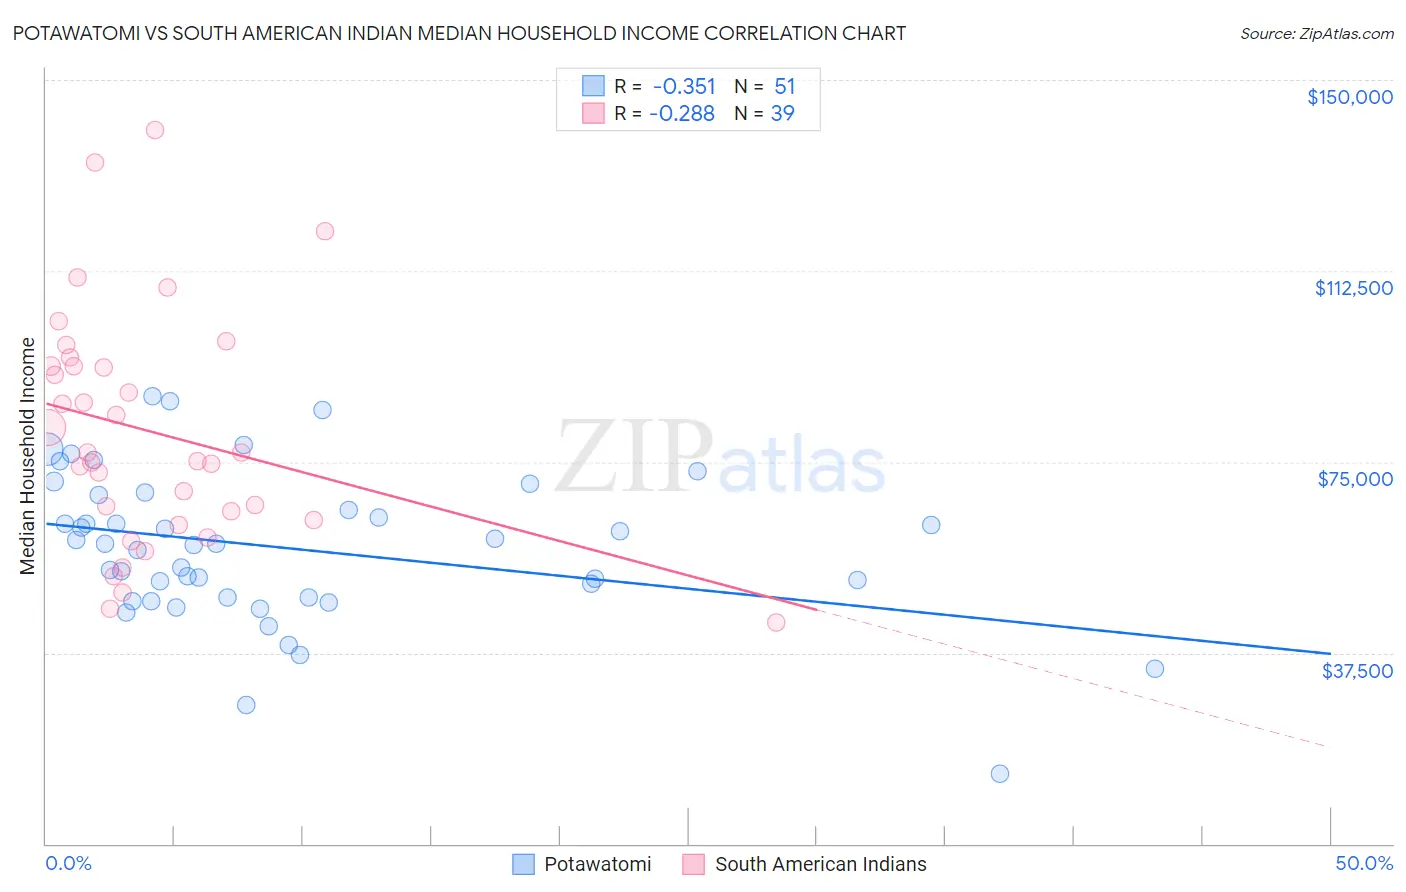
Potawatomi vs South American Indian Median Household Income Correlation Chart
The statistical analysis conducted on geographies consisting of 117,750,018 people shows a mild negative correlation between the proportion of Potawatomi and median household income in the United States with a correlation coefficient (R) of -0.351 and weighted average of $72,576. Similarly, the statistical analysis conducted on geographies consisting of 164,527,157 people shows a weak negative correlation between the proportion of South American Indians and median household income in the United States with a correlation coefficient (R) of -0.288 and weighted average of $87,446, a difference of 20.5%.
Median Household Income Correlation Summary
| Measurement | Potawatomi | South American Indian |
| Minimum | $13,750 | $43,438 |
| Maximum | $87,880 | $140,082 |
| Range | $74,130 | $96,644 |
| Mean | $58,038 | $80,839 |
| Median | $58,924 | $76,875 |
| Interquartile 25% (IQ1) | $48,403 | $63,676 |
| Interquartile 75% (IQ3) | $68,477 | $93,892 |
| Interquartile Range (IQR) | $20,074 | $30,216 |
| Standard Deviation (Sample) | $14,790 | $22,835 |
| Standard Deviation (Population) | $14,645 | $22,540 |
Similar Demographics by Median Household Income
Demographics Similar to Potawatomi by Median Household Income
In terms of median household income, the demographic groups most similar to Potawatomi are Honduran ($72,588, a difference of 0.020%), Immigrants from Haiti ($72,599, a difference of 0.030%), African ($72,650, a difference of 0.10%), Shoshone ($72,660, a difference of 0.12%), and Cherokee ($72,682, a difference of 0.15%).
| Demographics | Rating | Rank | Median Household Income |
| Indonesians | 0.0 /100 | #299 | Tragic $72,856 |
| Immigrants | Dominica | 0.0 /100 | #300 | Tragic $72,760 |
| Cherokee | 0.0 /100 | #301 | Tragic $72,682 |
| Shoshone | 0.0 /100 | #302 | Tragic $72,660 |
| Africans | 0.0 /100 | #303 | Tragic $72,650 |
| Immigrants | Haiti | 0.0 /100 | #304 | Tragic $72,599 |
| Hondurans | 0.0 /100 | #305 | Tragic $72,588 |
| Potawatomi | 0.0 /100 | #306 | Tragic $72,576 |
| Ute | 0.0 /100 | #307 | Tragic $72,402 |
| Yakama | 0.0 /100 | #308 | Tragic $72,225 |
| Immigrants | Caribbean | 0.0 /100 | #309 | Tragic $71,860 |
| U.S. Virgin Islanders | 0.0 /100 | #310 | Tragic $71,853 |
| Immigrants | Zaire | 0.0 /100 | #311 | Tragic $71,801 |
| Immigrants | Honduras | 0.0 /100 | #312 | Tragic $71,452 |
| Immigrants | Bahamas | 0.0 /100 | #313 | Tragic $71,349 |
Demographics Similar to South American Indians by Median Household Income
In terms of median household income, the demographic groups most similar to South American Indians are Immigrants from Uganda ($87,553, a difference of 0.12%), Ugandan ($87,557, a difference of 0.13%), Serbian ($87,572, a difference of 0.14%), Costa Rican ($87,262, a difference of 0.21%), and Danish ($87,676, a difference of 0.26%).
| Demographics | Rating | Rank | Median Household Income |
| Lebanese | 87.2 /100 | #140 | Excellent $88,091 |
| Immigrants | Morocco | 86.0 /100 | #141 | Excellent $87,930 |
| Canadians | 84.7 /100 | #142 | Excellent $87,769 |
| Danes | 83.9 /100 | #143 | Excellent $87,676 |
| Serbians | 83.0 /100 | #144 | Excellent $87,572 |
| Ugandans | 82.9 /100 | #145 | Excellent $87,557 |
| Immigrants | Uganda | 82.8 /100 | #146 | Excellent $87,553 |
| South American Indians | 81.8 /100 | #147 | Excellent $87,446 |
| Costa Ricans | 80.0 /100 | #148 | Excellent $87,262 |
| Immigrants | Nepal | 77.7 /100 | #149 | Good $87,046 |
| Basques | 77.2 /100 | #150 | Good $87,001 |
| Hungarians | 76.3 /100 | #151 | Good $86,920 |
| Immigrants | Saudi Arabia | 75.8 /100 | #152 | Good $86,875 |
| South Americans | 75.1 /100 | #153 | Good $86,824 |
| Immigrants | Germany | 74.4 /100 | #154 | Good $86,764 |