Immigrants from Argentina vs French American Indian Median Household Income
COMPARE
Immigrants from Argentina
French American Indian
Median Household Income
Median Household Income Comparison
Immigrants from Argentina
French American Indians
$92,417
MEDIAN HOUSEHOLD INCOME
99.1/ 100
METRIC RATING
84th/ 347
METRIC RANK
$76,387
MEDIAN HOUSEHOLD INCOME
0.4/ 100
METRIC RATING
262nd/ 347
METRIC RANK
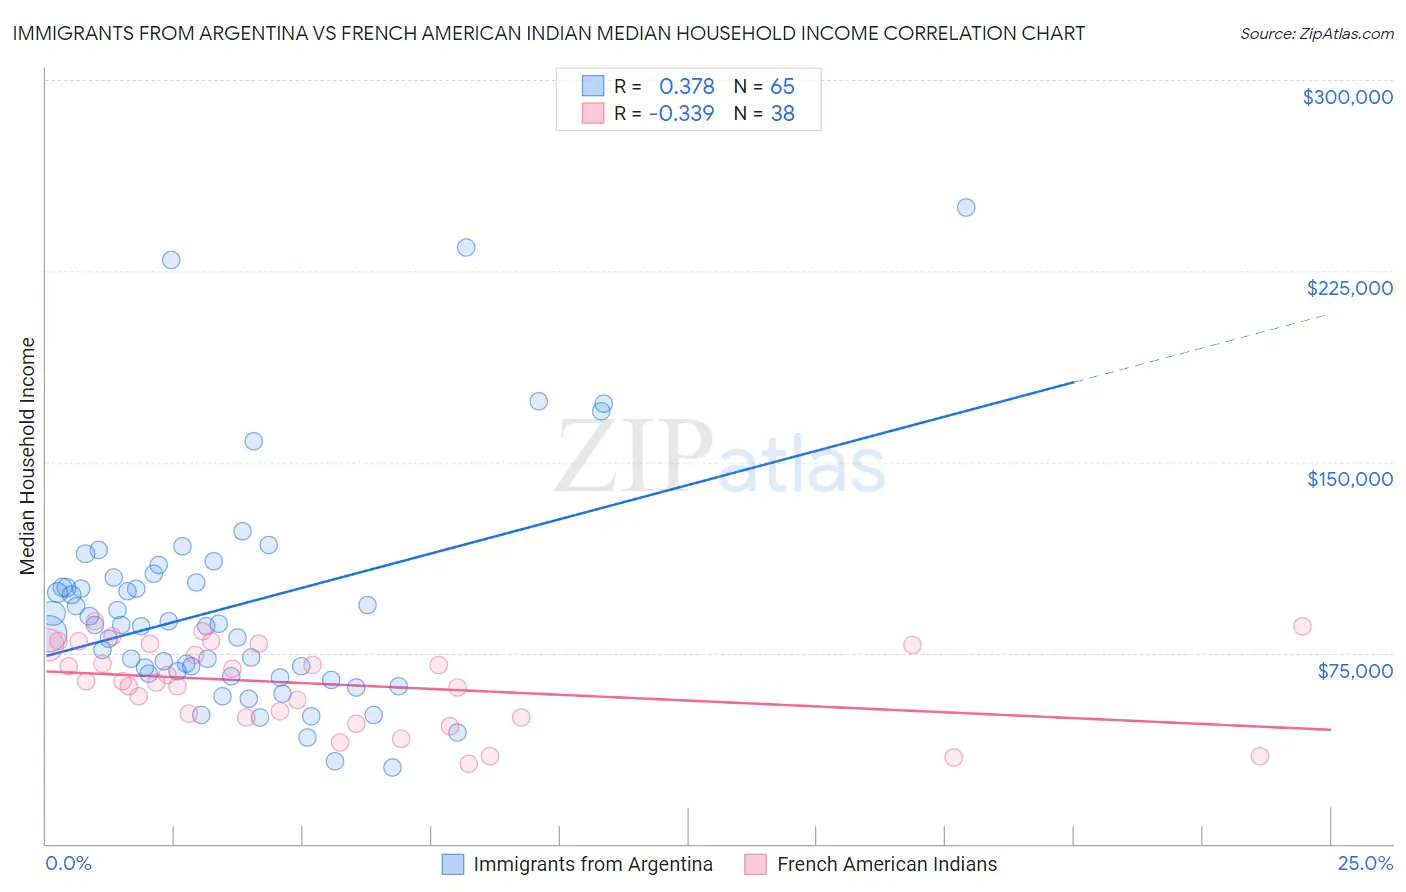
Immigrants from Argentina vs French American Indian Median Household Income Correlation Chart
The statistical analysis conducted on geographies consisting of 264,333,035 people shows a mild positive correlation between the proportion of Immigrants from Argentina and median household income in the United States with a correlation coefficient (R) of 0.378 and weighted average of $92,417. Similarly, the statistical analysis conducted on geographies consisting of 131,952,383 people shows a mild negative correlation between the proportion of French American Indians and median household income in the United States with a correlation coefficient (R) of -0.339 and weighted average of $76,387, a difference of 21.0%.
Median Household Income Correlation Summary
| Measurement | Immigrants from Argentina | French American Indian |
| Minimum | $29,759 | $31,325 |
| Maximum | $250,001 | $87,295 |
| Range | $220,242 | $55,970 |
| Mean | $92,999 | $62,652 |
| Median | $85,824 | $63,795 |
| Interquartile 25% (IQ1) | $66,317 | $49,785 |
| Interquartile 75% (IQ3) | $103,452 | $78,132 |
| Interquartile Range (IQR) | $37,135 | $28,346 |
| Standard Deviation (Sample) | $44,164 | $16,205 |
| Standard Deviation (Population) | $43,823 | $15,990 |
Similar Demographics by Median Household Income
Demographics Similar to Immigrants from Argentina by Median Household Income
In terms of median household income, the demographic groups most similar to Immigrants from Argentina are Italian ($92,475, a difference of 0.060%), Immigrants from Croatia ($92,225, a difference of 0.21%), Immigrants from Spain ($92,732, a difference of 0.34%), Immigrants from England ($92,098, a difference of 0.35%), and Immigrants from Hungary ($92,094, a difference of 0.35%).
| Demographics | Rating | Rank | Median Household Income |
| Immigrants | Afghanistan | 99.5 /100 | #77 | Exceptional $93,375 |
| Immigrants | Bulgaria | 99.4 /100 | #78 | Exceptional $93,148 |
| Sri Lankans | 99.4 /100 | #79 | Exceptional $93,093 |
| Tongans | 99.4 /100 | #80 | Exceptional $93,076 |
| Immigrants | Eastern Europe | 99.4 /100 | #81 | Exceptional $93,051 |
| Immigrants | Spain | 99.3 /100 | #82 | Exceptional $92,732 |
| Italians | 99.1 /100 | #83 | Exceptional $92,475 |
| Immigrants | Argentina | 99.1 /100 | #84 | Exceptional $92,417 |
| Immigrants | Croatia | 99.0 /100 | #85 | Exceptional $92,225 |
| Immigrants | England | 98.9 /100 | #86 | Exceptional $92,098 |
| Immigrants | Hungary | 98.9 /100 | #87 | Exceptional $92,094 |
| Immigrants | Canada | 98.8 /100 | #88 | Exceptional $92,029 |
| Romanians | 98.8 /100 | #89 | Exceptional $91,994 |
| Assyrians/Chaldeans/Syriacs | 98.8 /100 | #90 | Exceptional $91,991 |
| Immigrants | Vietnam | 98.8 /100 | #91 | Exceptional $91,987 |
Demographics Similar to French American Indians by Median Household Income
In terms of median household income, the demographic groups most similar to French American Indians are Alaskan Athabascan ($76,383, a difference of 0.010%), Immigrants from Grenada ($76,517, a difference of 0.17%), Jamaican ($76,583, a difference of 0.26%), Spanish American Indian ($76,670, a difference of 0.37%), and Immigrants from Nicaragua ($76,784, a difference of 0.52%).
| Demographics | Rating | Rank | Median Household Income |
| Immigrants | Middle Africa | 0.8 /100 | #255 | Tragic $77,559 |
| Belizeans | 0.6 /100 | #256 | Tragic $77,028 |
| Immigrants | Senegal | 0.5 /100 | #257 | Tragic $76,915 |
| Immigrants | Nicaragua | 0.5 /100 | #258 | Tragic $76,784 |
| Spanish American Indians | 0.4 /100 | #259 | Tragic $76,670 |
| Jamaicans | 0.4 /100 | #260 | Tragic $76,583 |
| Immigrants | Grenada | 0.4 /100 | #261 | Tragic $76,517 |
| French American Indians | 0.4 /100 | #262 | Tragic $76,387 |
| Alaskan Athabascans | 0.4 /100 | #263 | Tragic $76,383 |
| Guatemalans | 0.3 /100 | #264 | Tragic $75,961 |
| Immigrants | Belize | 0.3 /100 | #265 | Tragic $75,938 |
| Americans | 0.3 /100 | #266 | Tragic $75,932 |
| German Russians | 0.3 /100 | #267 | Tragic $75,856 |
| Immigrants | Jamaica | 0.3 /100 | #268 | Tragic $75,851 |
| Cape Verdeans | 0.3 /100 | #269 | Tragic $75,848 |