Polish vs Guamanian/Chamorro Householder Income Ages 25 - 44 years
COMPARE
Polish
Guamanian/Chamorro
Householder Income Ages 25 - 44 years
Householder Income Ages 25 - 44 years Comparison
Poles
Guamanians/Chamorros
$99,685
HOUSEHOLDER INCOME AGES 25 - 44 YEARS
94.5/ 100
METRIC RATING
112th/ 347
METRIC RANK
$93,569
HOUSEHOLDER INCOME AGES 25 - 44 YEARS
36.5/ 100
METRIC RATING
183rd/ 347
METRIC RANK
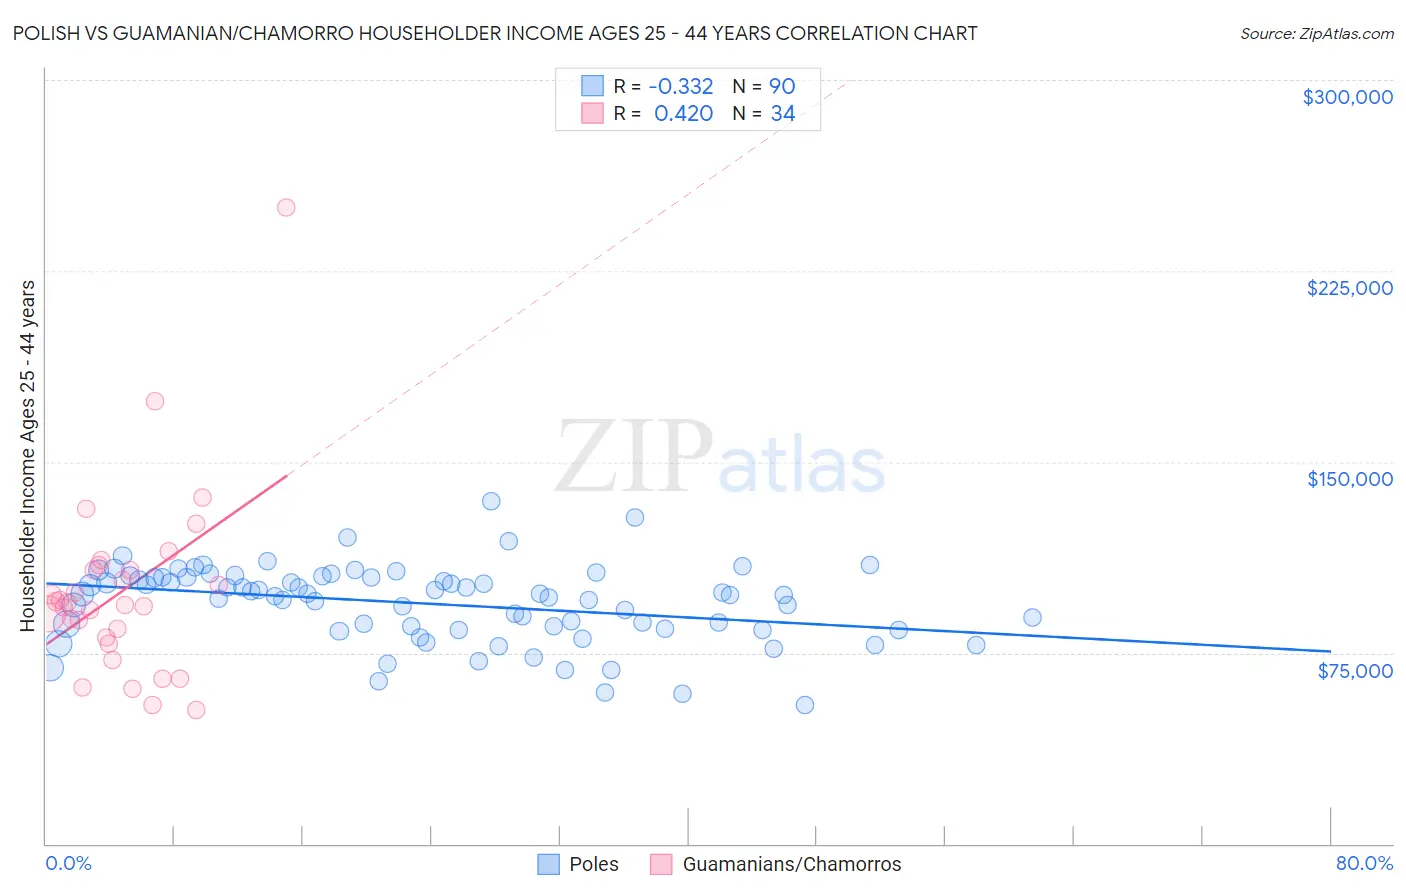
Polish vs Guamanian/Chamorro Householder Income Ages 25 - 44 years Correlation Chart
The statistical analysis conducted on geographies consisting of 555,649,021 people shows a mild negative correlation between the proportion of Poles and household income with householder between the ages 25 and 44 in the United States with a correlation coefficient (R) of -0.332 and weighted average of $99,685. Similarly, the statistical analysis conducted on geographies consisting of 221,693,514 people shows a moderate positive correlation between the proportion of Guamanians/Chamorros and household income with householder between the ages 25 and 44 in the United States with a correlation coefficient (R) of 0.420 and weighted average of $93,569, a difference of 6.5%.
Householder Income Ages 25 - 44 years Correlation Summary
| Measurement | Polish | Guamanian/Chamorro |
| Minimum | $54,279 | $52,500 |
| Maximum | $134,668 | $250,001 |
| Range | $80,389 | $197,501 |
| Mean | $94,388 | $99,073 |
| Median | $97,963 | $94,237 |
| Interquartile 25% (IQ1) | $84,559 | $81,009 |
| Interquartile 75% (IQ3) | $104,554 | $107,396 |
| Interquartile Range (IQR) | $19,995 | $26,387 |
| Standard Deviation (Sample) | $15,033 | $36,403 |
| Standard Deviation (Population) | $14,949 | $35,864 |
Similar Demographics by Householder Income Ages 25 - 44 years
Demographics Similar to Poles by Householder Income Ages 25 - 44 years
In terms of householder income ages 25 - 44 years, the demographic groups most similar to Poles are Tongan ($99,604, a difference of 0.080%), Immigrants from Western Asia ($99,516, a difference of 0.17%), Chilean ($99,900, a difference of 0.22%), Carpatho Rusyn ($99,449, a difference of 0.24%), and Portuguese ($99,429, a difference of 0.26%).
| Demographics | Rating | Rank | Householder Income Ages 25 - 44 years |
| Immigrants | Vietnam | 96.5 /100 | #105 | Exceptional $100,535 |
| Immigrants | Brazil | 96.5 /100 | #106 | Exceptional $100,534 |
| Northern Europeans | 96.3 /100 | #107 | Exceptional $100,457 |
| Immigrants | South Eastern Asia | 96.0 /100 | #108 | Exceptional $100,283 |
| Immigrants | North Macedonia | 95.6 /100 | #109 | Exceptional $100,101 |
| Immigrants | Afghanistan | 95.3 /100 | #110 | Exceptional $99,977 |
| Chileans | 95.1 /100 | #111 | Exceptional $99,900 |
| Poles | 94.5 /100 | #112 | Exceptional $99,685 |
| Tongans | 94.2 /100 | #113 | Exceptional $99,604 |
| Immigrants | Western Asia | 94.0 /100 | #114 | Exceptional $99,516 |
| Carpatho Rusyns | 93.7 /100 | #115 | Exceptional $99,449 |
| Portuguese | 93.7 /100 | #116 | Exceptional $99,429 |
| Immigrants | Northern Africa | 93.0 /100 | #117 | Exceptional $99,232 |
| Syrians | 92.9 /100 | #118 | Exceptional $99,215 |
| Jordanians | 92.8 /100 | #119 | Exceptional $99,186 |
Demographics Similar to Guamanians/Chamorros by Householder Income Ages 25 - 44 years
In terms of householder income ages 25 - 44 years, the demographic groups most similar to Guamanians/Chamorros are German ($93,531, a difference of 0.040%), Uruguayan ($93,631, a difference of 0.070%), French ($93,665, a difference of 0.10%), Puget Sound Salish ($93,661, a difference of 0.10%), and Immigrants from Eritrea ($93,466, a difference of 0.11%).
| Demographics | Rating | Rank | Householder Income Ages 25 - 44 years |
| Immigrants | Immigrants | 48.0 /100 | #176 | Average $94,423 |
| Belgians | 45.8 /100 | #177 | Average $94,262 |
| Immigrants | South America | 42.8 /100 | #178 | Average $94,042 |
| French Canadians | 38.2 /100 | #179 | Fair $93,694 |
| French | 37.8 /100 | #180 | Fair $93,665 |
| Puget Sound Salish | 37.7 /100 | #181 | Fair $93,661 |
| Uruguayans | 37.3 /100 | #182 | Fair $93,631 |
| Guamanians/Chamorros | 36.5 /100 | #183 | Fair $93,569 |
| Germans | 36.0 /100 | #184 | Fair $93,531 |
| Immigrants | Eritrea | 35.2 /100 | #185 | Fair $93,466 |
| Sierra Leoneans | 34.8 /100 | #186 | Fair $93,435 |
| Spaniards | 34.0 /100 | #187 | Fair $93,366 |
| Immigrants | Sierra Leone | 30.9 /100 | #188 | Fair $93,115 |
| Dutch | 30.5 /100 | #189 | Fair $93,081 |
| Welsh | 30.0 /100 | #190 | Fair $93,039 |