Immigrants from Sierra Leone vs Tsimshian Householder Income Ages 25 - 44 years
COMPARE
Immigrants from Sierra Leone
Tsimshian
Householder Income Ages 25 - 44 years
Householder Income Ages 25 - 44 years Comparison
Immigrants from Sierra Leone
Tsimshian
$93,115
HOUSEHOLDER INCOME AGES 25 - 44 YEARS
30.9/ 100
METRIC RATING
188th/ 347
METRIC RANK
$97,809
HOUSEHOLDER INCOME AGES 25 - 44 YEARS
85.8/ 100
METRIC RATING
133rd/ 347
METRIC RANK
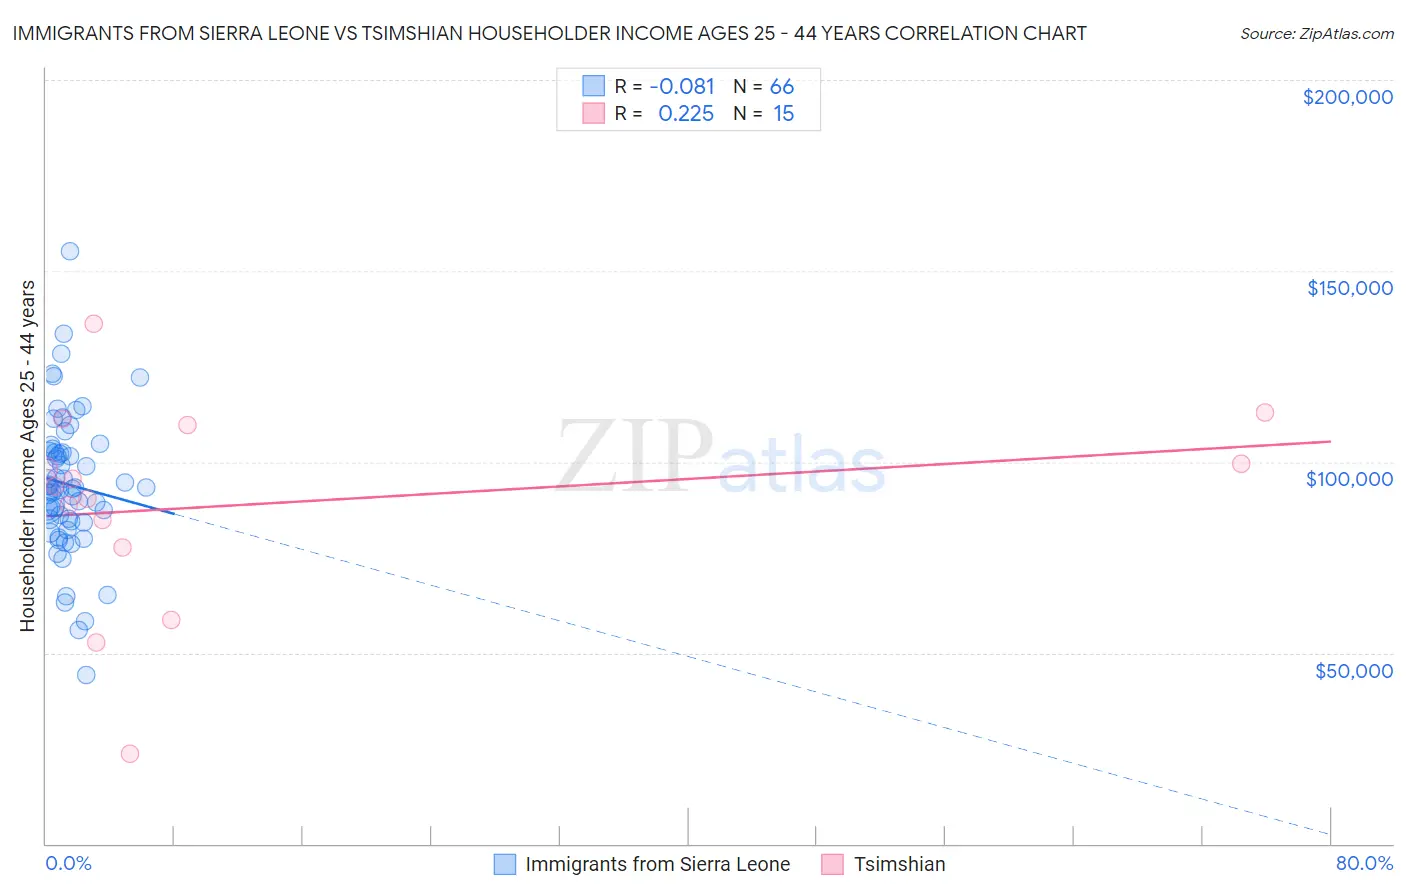
Immigrants from Sierra Leone vs Tsimshian Householder Income Ages 25 - 44 years Correlation Chart
The statistical analysis conducted on geographies consisting of 101,610,295 people shows a slight negative correlation between the proportion of Immigrants from Sierra Leone and household income with householder between the ages 25 and 44 in the United States with a correlation coefficient (R) of -0.081 and weighted average of $93,115. Similarly, the statistical analysis conducted on geographies consisting of 15,621,525 people shows a weak positive correlation between the proportion of Tsimshian and household income with householder between the ages 25 and 44 in the United States with a correlation coefficient (R) of 0.225 and weighted average of $97,809, a difference of 5.0%.
Householder Income Ages 25 - 44 years Correlation Summary
| Measurement | Immigrants from Sierra Leone | Tsimshian |
| Minimum | $44,243 | $23,438 |
| Maximum | $155,156 | $136,250 |
| Range | $110,913 | $112,812 |
| Mean | $94,051 | $88,925 |
| Median | $93,126 | $93,749 |
| Interquartile 25% (IQ1) | $84,614 | $77,546 |
| Interquartile 75% (IQ3) | $102,869 | $109,750 |
| Interquartile Range (IQR) | $18,254 | $32,204 |
| Standard Deviation (Sample) | $18,629 | $27,608 |
| Standard Deviation (Population) | $18,487 | $26,672 |
Similar Demographics by Householder Income Ages 25 - 44 years
Demographics Similar to Immigrants from Sierra Leone by Householder Income Ages 25 - 44 years
In terms of householder income ages 25 - 44 years, the demographic groups most similar to Immigrants from Sierra Leone are Dutch ($93,081, a difference of 0.040%), Welsh ($93,039, a difference of 0.080%), Tlingit-Haida ($92,987, a difference of 0.14%), Immigrants from Costa Rica ($92,876, a difference of 0.26%), and Spaniard ($93,366, a difference of 0.27%).
| Demographics | Rating | Rank | Householder Income Ages 25 - 44 years |
| Puget Sound Salish | 37.7 /100 | #181 | Fair $93,661 |
| Uruguayans | 37.3 /100 | #182 | Fair $93,631 |
| Guamanians/Chamorros | 36.5 /100 | #183 | Fair $93,569 |
| Germans | 36.0 /100 | #184 | Fair $93,531 |
| Immigrants | Eritrea | 35.2 /100 | #185 | Fair $93,466 |
| Sierra Leoneans | 34.8 /100 | #186 | Fair $93,435 |
| Spaniards | 34.0 /100 | #187 | Fair $93,366 |
| Immigrants | Sierra Leone | 30.9 /100 | #188 | Fair $93,115 |
| Dutch | 30.5 /100 | #189 | Fair $93,081 |
| Welsh | 30.0 /100 | #190 | Fair $93,039 |
| Tlingit-Haida | 29.4 /100 | #191 | Fair $92,987 |
| Immigrants | Costa Rica | 28.2 /100 | #192 | Fair $92,876 |
| Samoans | 23.0 /100 | #193 | Fair $92,385 |
| Immigrants | Azores | 22.4 /100 | #194 | Fair $92,322 |
| Celtics | 21.6 /100 | #195 | Fair $92,241 |
Demographics Similar to Tsimshian by Householder Income Ages 25 - 44 years
In terms of householder income ages 25 - 44 years, the demographic groups most similar to Tsimshian are Immigrants from Zimbabwe ($97,880, a difference of 0.070%), Immigrants from Albania ($97,929, a difference of 0.12%), Canadian ($97,625, a difference of 0.19%), Immigrants from Oceania ($97,623, a difference of 0.19%), and Hungarian ($97,544, a difference of 0.27%).
| Demographics | Rating | Rank | Householder Income Ages 25 - 44 years |
| British | 89.1 /100 | #126 | Excellent $98,359 |
| Serbians | 88.9 /100 | #127 | Excellent $98,320 |
| Europeans | 88.9 /100 | #128 | Excellent $98,310 |
| Brazilians | 88.6 /100 | #129 | Excellent $98,267 |
| Immigrants | Kuwait | 87.8 /100 | #130 | Excellent $98,122 |
| Immigrants | Albania | 86.6 /100 | #131 | Excellent $97,929 |
| Immigrants | Zimbabwe | 86.3 /100 | #132 | Excellent $97,880 |
| Tsimshian | 85.8 /100 | #133 | Excellent $97,809 |
| Canadians | 84.5 /100 | #134 | Excellent $97,625 |
| Immigrants | Oceania | 84.5 /100 | #135 | Excellent $97,623 |
| Hungarians | 83.9 /100 | #136 | Excellent $97,544 |
| Lebanese | 82.3 /100 | #137 | Excellent $97,339 |
| Arabs | 82.3 /100 | #138 | Excellent $97,336 |
| Immigrants | Peru | 82.2 /100 | #139 | Excellent $97,329 |
| Immigrants | Morocco | 82.0 /100 | #140 | Excellent $97,305 |