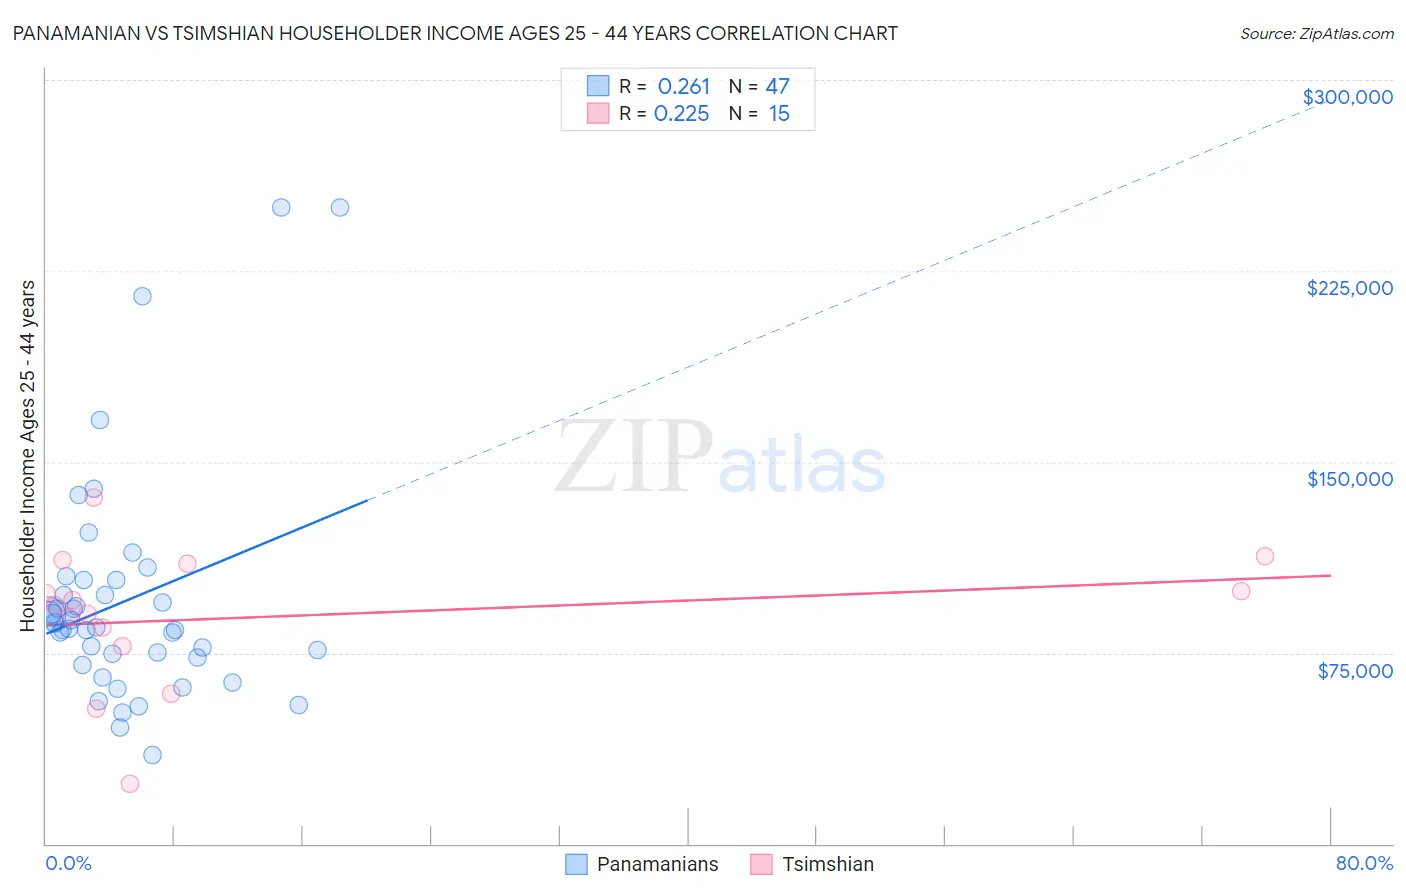
Panamanian vs Tsimshian Householder Income Ages 25 - 44 years
COMPARE
Panamanian
Tsimshian
Householder Income Ages 25 - 44 years
Householder Income Ages 25 - 44 years Comparison
Panamanians
Tsimshian
$90,193
HOUSEHOLDER INCOME AGES 25 - 44 YEARS
8.1/ 100
METRIC RATING
215th/ 347
METRIC RANK
$97,809
HOUSEHOLDER INCOME AGES 25 - 44 YEARS
85.8/ 100
METRIC RATING
133rd/ 347
METRIC RANK
Panamanian vs Tsimshian Householder Income Ages 25 - 44 years Correlation Chart
The statistical analysis conducted on geographies consisting of 280,855,443 people shows a weak positive correlation between the proportion of Panamanians and household income with householder between the ages 25 and 44 in the United States with a correlation coefficient (R) of 0.261 and weighted average of $90,193. Similarly, the statistical analysis conducted on geographies consisting of 15,621,525 people shows a weak positive correlation between the proportion of Tsimshian and household income with householder between the ages 25 and 44 in the United States with a correlation coefficient (R) of 0.225 and weighted average of $97,809, a difference of 8.4%.
Householder Income Ages 25 - 44 years Correlation Summary
| Measurement | Panamanian | Tsimshian |
| Minimum | $34,890 | $23,438 |
| Maximum | $250,001 | $136,250 |
| Range | $215,111 | $112,812 |
| Mean | $95,499 | $88,925 |
| Median | $85,019 | $93,749 |
| Interquartile 25% (IQ1) | $72,969 | $77,546 |
| Interquartile 75% (IQ3) | $103,669 | $109,750 |
| Interquartile Range (IQR) | $30,700 | $32,204 |
| Standard Deviation (Sample) | $45,169 | $27,608 |
| Standard Deviation (Population) | $44,686 | $26,672 |
Similar Demographics by Householder Income Ages 25 - 44 years
Demographics Similar to Panamanians by Householder Income Ages 25 - 44 years
In terms of householder income ages 25 - 44 years, the demographic groups most similar to Panamanians are Ghanaian ($90,137, a difference of 0.060%), Immigrants from Africa ($90,372, a difference of 0.20%), Scotch-Irish ($89,969, a difference of 0.25%), Immigrants from Bangladesh ($90,448, a difference of 0.28%), and Guyanese ($89,940, a difference of 0.28%).
| Demographics | Rating | Rank | Householder Income Ages 25 - 44 years |
| Immigrants | Thailand | 14.3 /100 | #208 | Poor $91,337 |
| Immigrants | Uruguay | 13.2 /100 | #209 | Poor $91,171 |
| Immigrants | Kenya | 10.9 /100 | #210 | Poor $90,767 |
| Iraqis | 10.8 /100 | #211 | Poor $90,764 |
| Hawaiians | 10.6 /100 | #212 | Poor $90,722 |
| Immigrants | Bangladesh | 9.3 /100 | #213 | Tragic $90,448 |
| Immigrants | Africa | 8.9 /100 | #214 | Tragic $90,372 |
| Panamanians | 8.1 /100 | #215 | Tragic $90,193 |
| Ghanaians | 7.9 /100 | #216 | Tragic $90,137 |
| Scotch-Irish | 7.3 /100 | #217 | Tragic $89,969 |
| Guyanese | 7.1 /100 | #218 | Tragic $89,940 |
| Delaware | 6.9 /100 | #219 | Tragic $89,876 |
| Trinidadians and Tobagonians | 6.8 /100 | #220 | Tragic $89,856 |
| Immigrants | Trinidad and Tobago | 6.5 /100 | #221 | Tragic $89,748 |
| Immigrants | Ecuador | 6.2 /100 | #222 | Tragic $89,673 |
Demographics Similar to Tsimshian by Householder Income Ages 25 - 44 years
In terms of householder income ages 25 - 44 years, the demographic groups most similar to Tsimshian are Immigrants from Zimbabwe ($97,880, a difference of 0.070%), Immigrants from Albania ($97,929, a difference of 0.12%), Canadian ($97,625, a difference of 0.19%), Immigrants from Oceania ($97,623, a difference of 0.19%), and Hungarian ($97,544, a difference of 0.27%).
| Demographics | Rating | Rank | Householder Income Ages 25 - 44 years |
| British | 89.1 /100 | #126 | Excellent $98,359 |
| Serbians | 88.9 /100 | #127 | Excellent $98,320 |
| Europeans | 88.9 /100 | #128 | Excellent $98,310 |
| Brazilians | 88.6 /100 | #129 | Excellent $98,267 |
| Immigrants | Kuwait | 87.8 /100 | #130 | Excellent $98,122 |
| Immigrants | Albania | 86.6 /100 | #131 | Excellent $97,929 |
| Immigrants | Zimbabwe | 86.3 /100 | #132 | Excellent $97,880 |
| Tsimshian | 85.8 /100 | #133 | Excellent $97,809 |
| Canadians | 84.5 /100 | #134 | Excellent $97,625 |
| Immigrants | Oceania | 84.5 /100 | #135 | Excellent $97,623 |
| Hungarians | 83.9 /100 | #136 | Excellent $97,544 |
| Lebanese | 82.3 /100 | #137 | Excellent $97,339 |
| Arabs | 82.3 /100 | #138 | Excellent $97,336 |
| Immigrants | Peru | 82.2 /100 | #139 | Excellent $97,329 |
| Immigrants | Morocco | 82.0 /100 | #140 | Excellent $97,305 |