Polish vs Immigrants from Bangladesh Householder Income Ages 25 - 44 years
COMPARE
Polish
Immigrants from Bangladesh
Householder Income Ages 25 - 44 years
Householder Income Ages 25 - 44 years Comparison
Poles
Immigrants from Bangladesh
$99,685
HOUSEHOLDER INCOME AGES 25 - 44 YEARS
94.5/ 100
METRIC RATING
112th/ 347
METRIC RANK
$90,448
HOUSEHOLDER INCOME AGES 25 - 44 YEARS
9.3/ 100
METRIC RATING
213th/ 347
METRIC RANK
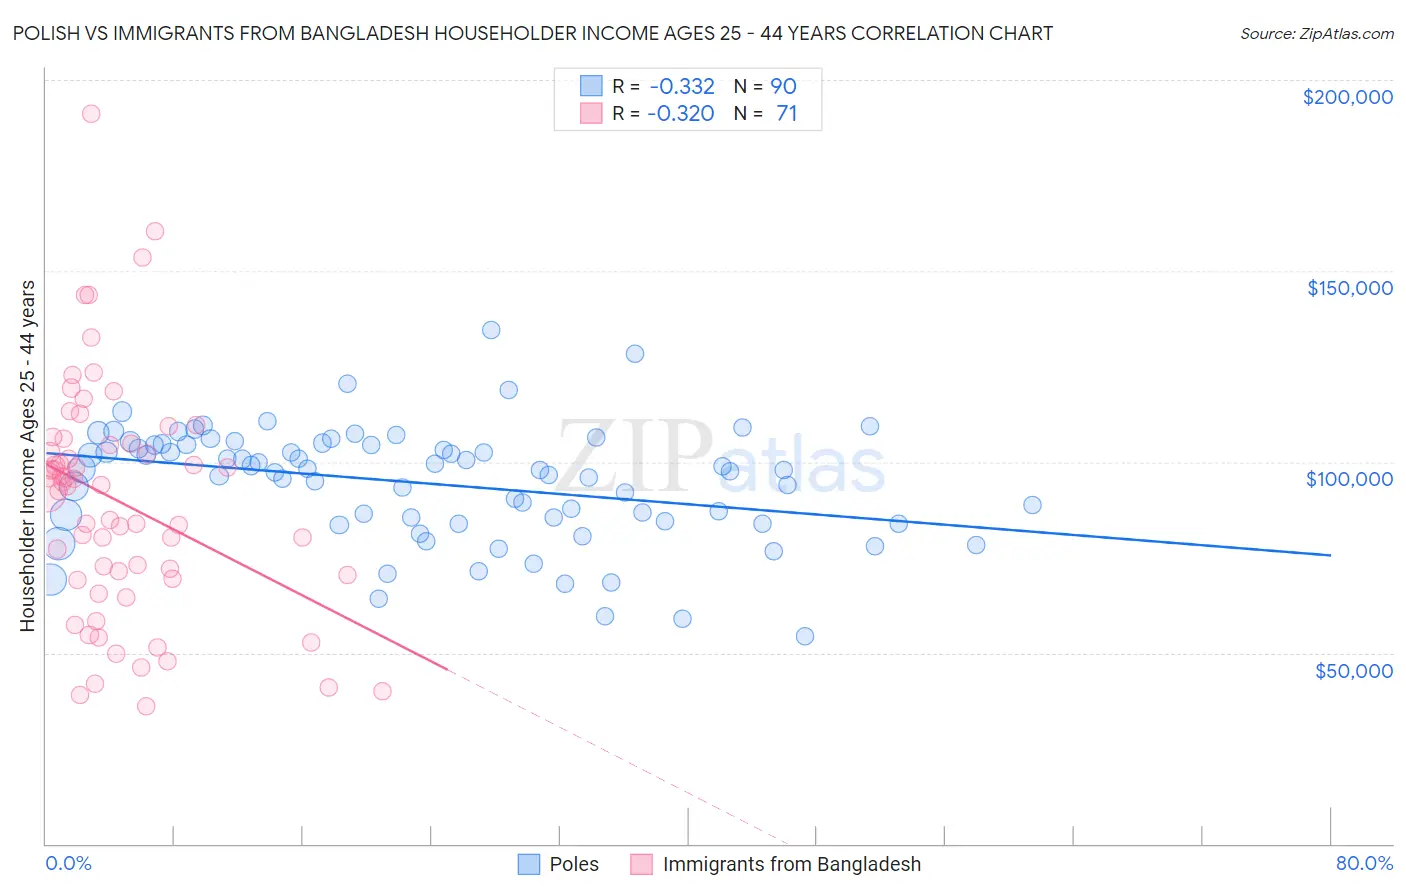
Polish vs Immigrants from Bangladesh Householder Income Ages 25 - 44 years Correlation Chart
The statistical analysis conducted on geographies consisting of 555,649,021 people shows a mild negative correlation between the proportion of Poles and household income with householder between the ages 25 and 44 in the United States with a correlation coefficient (R) of -0.332 and weighted average of $99,685. Similarly, the statistical analysis conducted on geographies consisting of 203,449,247 people shows a mild negative correlation between the proportion of Immigrants from Bangladesh and household income with householder between the ages 25 and 44 in the United States with a correlation coefficient (R) of -0.320 and weighted average of $90,448, a difference of 10.2%.
Householder Income Ages 25 - 44 years Correlation Summary
| Measurement | Polish | Immigrants from Bangladesh |
| Minimum | $54,279 | $35,868 |
| Maximum | $134,668 | $191,104 |
| Range | $80,389 | $155,236 |
| Mean | $94,388 | $89,510 |
| Median | $97,963 | $93,714 |
| Interquartile 25% (IQ1) | $84,559 | $69,551 |
| Interquartile 75% (IQ3) | $104,554 | $104,853 |
| Interquartile Range (IQR) | $19,995 | $35,302 |
| Standard Deviation (Sample) | $15,033 | $30,547 |
| Standard Deviation (Population) | $14,949 | $30,331 |
Similar Demographics by Householder Income Ages 25 - 44 years
Demographics Similar to Poles by Householder Income Ages 25 - 44 years
In terms of householder income ages 25 - 44 years, the demographic groups most similar to Poles are Tongan ($99,604, a difference of 0.080%), Immigrants from Western Asia ($99,516, a difference of 0.17%), Chilean ($99,900, a difference of 0.22%), Carpatho Rusyn ($99,449, a difference of 0.24%), and Portuguese ($99,429, a difference of 0.26%).
| Demographics | Rating | Rank | Householder Income Ages 25 - 44 years |
| Immigrants | Vietnam | 96.5 /100 | #105 | Exceptional $100,535 |
| Immigrants | Brazil | 96.5 /100 | #106 | Exceptional $100,534 |
| Northern Europeans | 96.3 /100 | #107 | Exceptional $100,457 |
| Immigrants | South Eastern Asia | 96.0 /100 | #108 | Exceptional $100,283 |
| Immigrants | North Macedonia | 95.6 /100 | #109 | Exceptional $100,101 |
| Immigrants | Afghanistan | 95.3 /100 | #110 | Exceptional $99,977 |
| Chileans | 95.1 /100 | #111 | Exceptional $99,900 |
| Poles | 94.5 /100 | #112 | Exceptional $99,685 |
| Tongans | 94.2 /100 | #113 | Exceptional $99,604 |
| Immigrants | Western Asia | 94.0 /100 | #114 | Exceptional $99,516 |
| Carpatho Rusyns | 93.7 /100 | #115 | Exceptional $99,449 |
| Portuguese | 93.7 /100 | #116 | Exceptional $99,429 |
| Immigrants | Northern Africa | 93.0 /100 | #117 | Exceptional $99,232 |
| Syrians | 92.9 /100 | #118 | Exceptional $99,215 |
| Jordanians | 92.8 /100 | #119 | Exceptional $99,186 |
Demographics Similar to Immigrants from Bangladesh by Householder Income Ages 25 - 44 years
In terms of householder income ages 25 - 44 years, the demographic groups most similar to Immigrants from Bangladesh are Immigrants from Africa ($90,372, a difference of 0.090%), Panamanian ($90,193, a difference of 0.28%), Hawaiian ($90,722, a difference of 0.30%), Immigrants from Kenya ($90,767, a difference of 0.35%), and Iraqi ($90,764, a difference of 0.35%).
| Demographics | Rating | Rank | Householder Income Ages 25 - 44 years |
| Aleuts | 14.5 /100 | #206 | Poor $91,370 |
| Yugoslavians | 14.5 /100 | #207 | Poor $91,368 |
| Immigrants | Thailand | 14.3 /100 | #208 | Poor $91,337 |
| Immigrants | Uruguay | 13.2 /100 | #209 | Poor $91,171 |
| Immigrants | Kenya | 10.9 /100 | #210 | Poor $90,767 |
| Iraqis | 10.8 /100 | #211 | Poor $90,764 |
| Hawaiians | 10.6 /100 | #212 | Poor $90,722 |
| Immigrants | Bangladesh | 9.3 /100 | #213 | Tragic $90,448 |
| Immigrants | Africa | 8.9 /100 | #214 | Tragic $90,372 |
| Panamanians | 8.1 /100 | #215 | Tragic $90,193 |
| Ghanaians | 7.9 /100 | #216 | Tragic $90,137 |
| Scotch-Irish | 7.3 /100 | #217 | Tragic $89,969 |
| Guyanese | 7.1 /100 | #218 | Tragic $89,940 |
| Delaware | 6.9 /100 | #219 | Tragic $89,876 |
| Trinidadians and Tobagonians | 6.8 /100 | #220 | Tragic $89,856 |