Polish vs Puerto Rican Householder Income Ages 25 - 44 years
COMPARE
Polish
Puerto Rican
Householder Income Ages 25 - 44 years
Householder Income Ages 25 - 44 years Comparison
Poles
Puerto Ricans
$99,685
HOUSEHOLDER INCOME AGES 25 - 44 YEARS
94.5/ 100
METRIC RATING
112th/ 347
METRIC RANK
$65,996
HOUSEHOLDER INCOME AGES 25 - 44 YEARS
0.0/ 100
METRIC RATING
346th/ 347
METRIC RANK
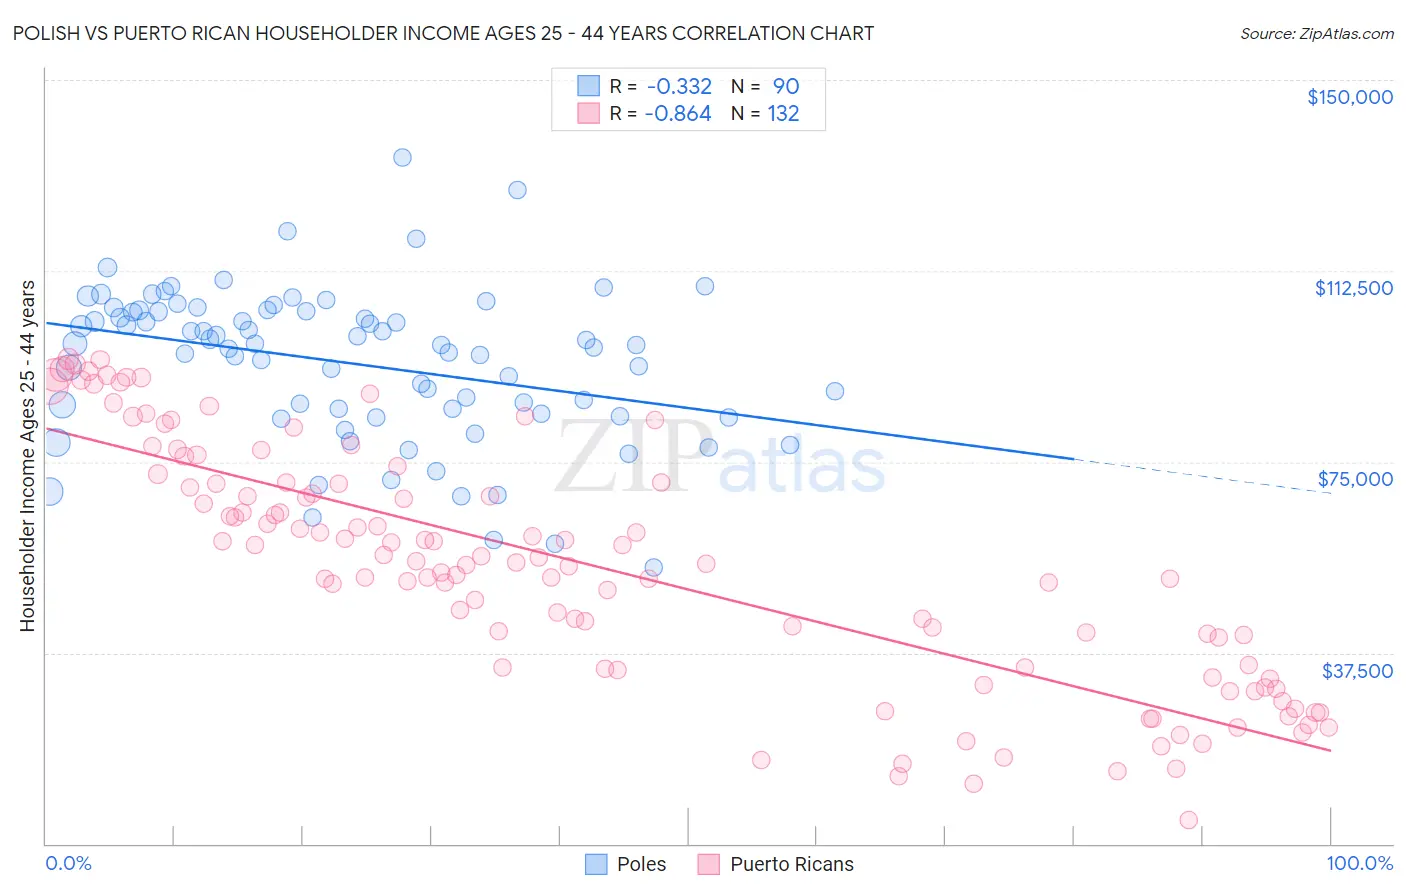
Polish vs Puerto Rican Householder Income Ages 25 - 44 years Correlation Chart
The statistical analysis conducted on geographies consisting of 555,649,021 people shows a mild negative correlation between the proportion of Poles and household income with householder between the ages 25 and 44 in the United States with a correlation coefficient (R) of -0.332 and weighted average of $99,685. Similarly, the statistical analysis conducted on geographies consisting of 525,288,469 people shows a very strong negative correlation between the proportion of Puerto Ricans and household income with householder between the ages 25 and 44 in the United States with a correlation coefficient (R) of -0.864 and weighted average of $65,996, a difference of 51.0%.
Householder Income Ages 25 - 44 years Correlation Summary
| Measurement | Polish | Puerto Rican |
| Minimum | $54,279 | $4,659 |
| Maximum | $134,668 | $95,273 |
| Range | $80,389 | $90,614 |
| Mean | $94,388 | $54,540 |
| Median | $97,963 | $55,330 |
| Interquartile 25% (IQ1) | $84,559 | $34,463 |
| Interquartile 75% (IQ3) | $104,554 | $70,867 |
| Interquartile Range (IQR) | $19,995 | $36,404 |
| Standard Deviation (Sample) | $15,033 | $23,369 |
| Standard Deviation (Population) | $14,949 | $23,280 |
Similar Demographics by Householder Income Ages 25 - 44 years
Demographics Similar to Poles by Householder Income Ages 25 - 44 years
In terms of householder income ages 25 - 44 years, the demographic groups most similar to Poles are Tongan ($99,604, a difference of 0.080%), Immigrants from Western Asia ($99,516, a difference of 0.17%), Chilean ($99,900, a difference of 0.22%), Carpatho Rusyn ($99,449, a difference of 0.24%), and Portuguese ($99,429, a difference of 0.26%).
| Demographics | Rating | Rank | Householder Income Ages 25 - 44 years |
| Immigrants | Vietnam | 96.5 /100 | #105 | Exceptional $100,535 |
| Immigrants | Brazil | 96.5 /100 | #106 | Exceptional $100,534 |
| Northern Europeans | 96.3 /100 | #107 | Exceptional $100,457 |
| Immigrants | South Eastern Asia | 96.0 /100 | #108 | Exceptional $100,283 |
| Immigrants | North Macedonia | 95.6 /100 | #109 | Exceptional $100,101 |
| Immigrants | Afghanistan | 95.3 /100 | #110 | Exceptional $99,977 |
| Chileans | 95.1 /100 | #111 | Exceptional $99,900 |
| Poles | 94.5 /100 | #112 | Exceptional $99,685 |
| Tongans | 94.2 /100 | #113 | Exceptional $99,604 |
| Immigrants | Western Asia | 94.0 /100 | #114 | Exceptional $99,516 |
| Carpatho Rusyns | 93.7 /100 | #115 | Exceptional $99,449 |
| Portuguese | 93.7 /100 | #116 | Exceptional $99,429 |
| Immigrants | Northern Africa | 93.0 /100 | #117 | Exceptional $99,232 |
| Syrians | 92.9 /100 | #118 | Exceptional $99,215 |
| Jordanians | 92.8 /100 | #119 | Exceptional $99,186 |
Demographics Similar to Puerto Ricans by Householder Income Ages 25 - 44 years
In terms of householder income ages 25 - 44 years, the demographic groups most similar to Puerto Ricans are Navajo ($66,529, a difference of 0.81%), Pueblo ($68,910, a difference of 4.4%), Tohono O'odham ($69,068, a difference of 4.6%), Crow ($71,337, a difference of 8.1%), and Arapaho ($71,697, a difference of 8.6%).
| Demographics | Rating | Rank | Householder Income Ages 25 - 44 years |
| Hopi | 0.0 /100 | #333 | Tragic $75,002 |
| Creek | 0.0 /100 | #334 | Tragic $74,847 |
| Kiowa | 0.0 /100 | #335 | Tragic $74,776 |
| Yup'ik | 0.0 /100 | #336 | Tragic $73,688 |
| Blacks/African Americans | 0.0 /100 | #337 | Tragic $73,370 |
| Immigrants | Yemen | 0.0 /100 | #338 | Tragic $73,043 |
| Yuman | 0.0 /100 | #339 | Tragic $72,956 |
| Immigrants | Congo | 0.0 /100 | #340 | Tragic $72,178 |
| Arapaho | 0.0 /100 | #341 | Tragic $71,697 |
| Crow | 0.0 /100 | #342 | Tragic $71,337 |
| Tohono O'odham | 0.0 /100 | #343 | Tragic $69,068 |
| Pueblo | 0.0 /100 | #344 | Tragic $68,910 |
| Navajo | 0.0 /100 | #345 | Tragic $66,529 |
| Puerto Ricans | 0.0 /100 | #346 | Tragic $65,996 |
| Lumbee | 0.0 /100 | #347 | Tragic $60,305 |