Polish vs Immigrants from Saudi Arabia Per Capita Income
COMPARE
Polish
Immigrants from Saudi Arabia
Per Capita Income
Per Capita Income Comparison
Poles
Immigrants from Saudi Arabia
$46,123
PER CAPITA INCOME
94.1/ 100
METRIC RATING
116th/ 347
METRIC RANK
$46,008
PER CAPITA INCOME
93.3/ 100
METRIC RATING
118th/ 347
METRIC RANK
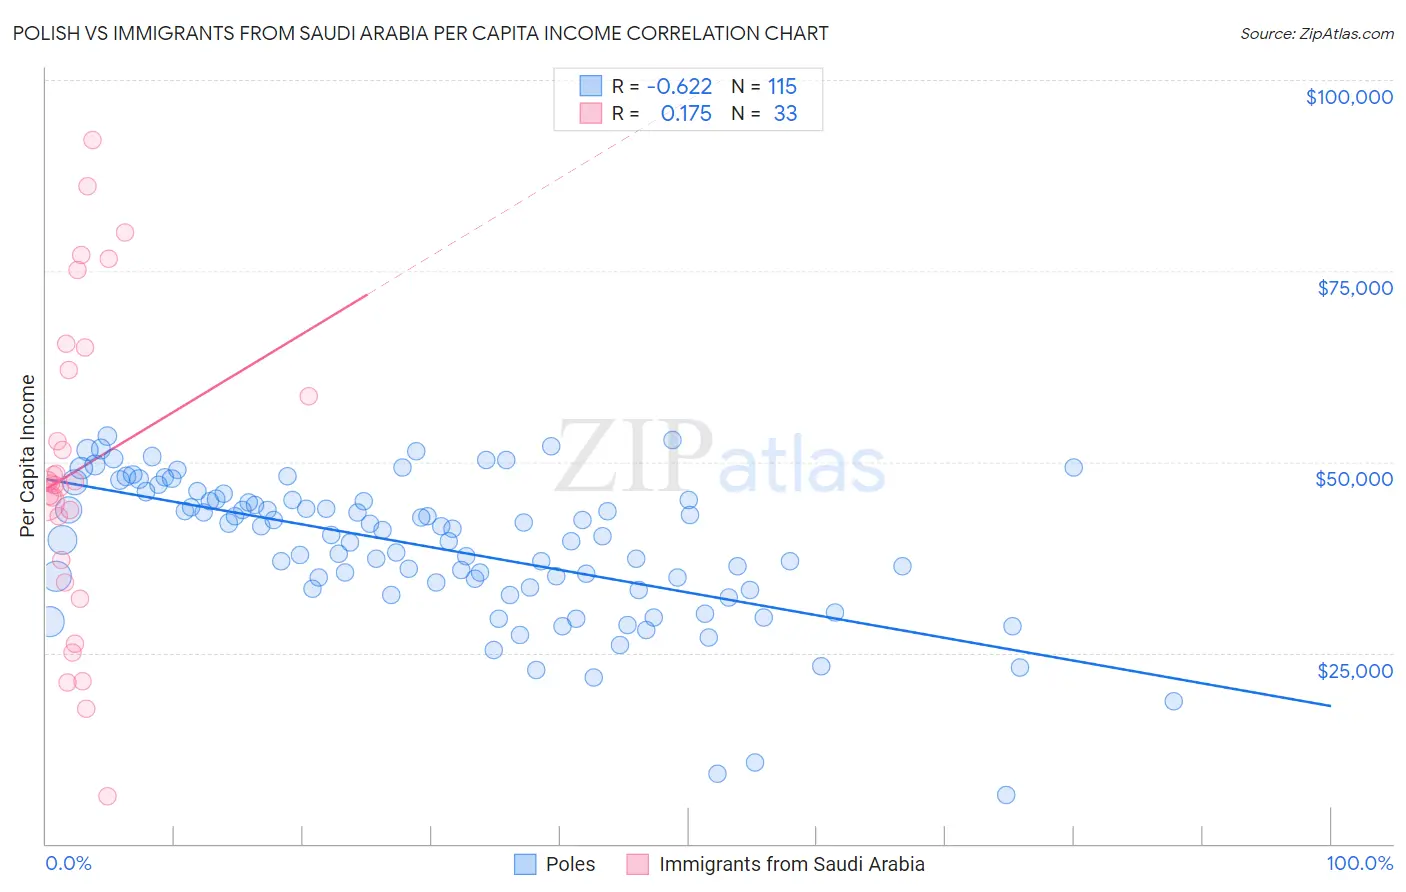
Polish vs Immigrants from Saudi Arabia Per Capita Income Correlation Chart
The statistical analysis conducted on geographies consisting of 560,657,396 people shows a significant negative correlation between the proportion of Poles and per capita income in the United States with a correlation coefficient (R) of -0.622 and weighted average of $46,123. Similarly, the statistical analysis conducted on geographies consisting of 164,297,329 people shows a poor positive correlation between the proportion of Immigrants from Saudi Arabia and per capita income in the United States with a correlation coefficient (R) of 0.175 and weighted average of $46,008, a difference of 0.25%.
Per Capita Income Correlation Summary
| Measurement | Polish | Immigrants from Saudi Arabia |
| Minimum | $6,461 | $6,252 |
| Maximum | $53,317 | $92,098 |
| Range | $46,856 | $85,846 |
| Mean | $38,750 | $49,029 |
| Median | $40,450 | $47,113 |
| Interquartile 25% (IQ1) | $33,437 | $35,703 |
| Interquartile 75% (IQ3) | $44,990 | $63,528 |
| Interquartile Range (IQR) | $11,553 | $27,825 |
| Standard Deviation (Sample) | $9,315 | $20,510 |
| Standard Deviation (Population) | $9,274 | $20,197 |
Demographics Similar to Poles and Immigrants from Saudi Arabia by Per Capita Income
In terms of per capita income, the demographic groups most similar to Poles are Chinese ($46,098, a difference of 0.050%), Immigrants from Chile ($46,213, a difference of 0.20%), Immigrants from Poland ($45,979, a difference of 0.31%), Afghan ($46,268, a difference of 0.32%), and Immigrants from Ethiopia ($45,923, a difference of 0.43%). Similarly, the demographic groups most similar to Immigrants from Saudi Arabia are Immigrants from Poland ($45,979, a difference of 0.060%), Chinese ($46,098, a difference of 0.19%), Immigrants from Ethiopia ($45,923, a difference of 0.19%), Canadian ($45,858, a difference of 0.33%), and Moroccan ($45,854, a difference of 0.34%).
| Demographics | Rating | Rank | Per Capita Income |
| Serbians | 96.2 /100 | #107 | Exceptional $46,551 |
| Immigrants | Kuwait | 96.2 /100 | #108 | Exceptional $46,543 |
| Immigrants | Northern Africa | 96.2 /100 | #109 | Exceptional $46,531 |
| Chileans | 95.9 /100 | #110 | Exceptional $46,459 |
| Taiwanese | 95.8 /100 | #111 | Exceptional $46,455 |
| Immigrants | Morocco | 95.7 /100 | #112 | Exceptional $46,430 |
| Immigrants | Albania | 95.5 /100 | #113 | Exceptional $46,387 |
| Afghans | 94.9 /100 | #114 | Exceptional $46,268 |
| Immigrants | Chile | 94.6 /100 | #115 | Exceptional $46,213 |
| Poles | 94.1 /100 | #116 | Exceptional $46,123 |
| Chinese | 93.9 /100 | #117 | Exceptional $46,098 |
| Immigrants | Saudi Arabia | 93.3 /100 | #118 | Exceptional $46,008 |
| Immigrants | Poland | 93.1 /100 | #119 | Exceptional $45,979 |
| Immigrants | Ethiopia | 92.7 /100 | #120 | Exceptional $45,923 |
| Canadians | 92.2 /100 | #121 | Exceptional $45,858 |
| Moroccans | 92.1 /100 | #122 | Exceptional $45,854 |
| Lebanese | 92.0 /100 | #123 | Exceptional $45,840 |
| Europeans | 92.0 /100 | #124 | Exceptional $45,836 |
| Zimbabweans | 91.7 /100 | #125 | Exceptional $45,804 |
| Palestinians | 91.6 /100 | #126 | Exceptional $45,790 |
| Immigrants | Germany | 91.3 /100 | #127 | Exceptional $45,751 |