U.S. Virgin Islander vs Immigrants from Saudi Arabia Per Capita Income
COMPARE
U.S. Virgin Islander
Immigrants from Saudi Arabia
Per Capita Income
Per Capita Income Comparison
U.S. Virgin Islanders
Immigrants from Saudi Arabia
$37,589
PER CAPITA INCOME
0.1/ 100
METRIC RATING
289th/ 347
METRIC RANK
$46,008
PER CAPITA INCOME
93.3/ 100
METRIC RATING
118th/ 347
METRIC RANK
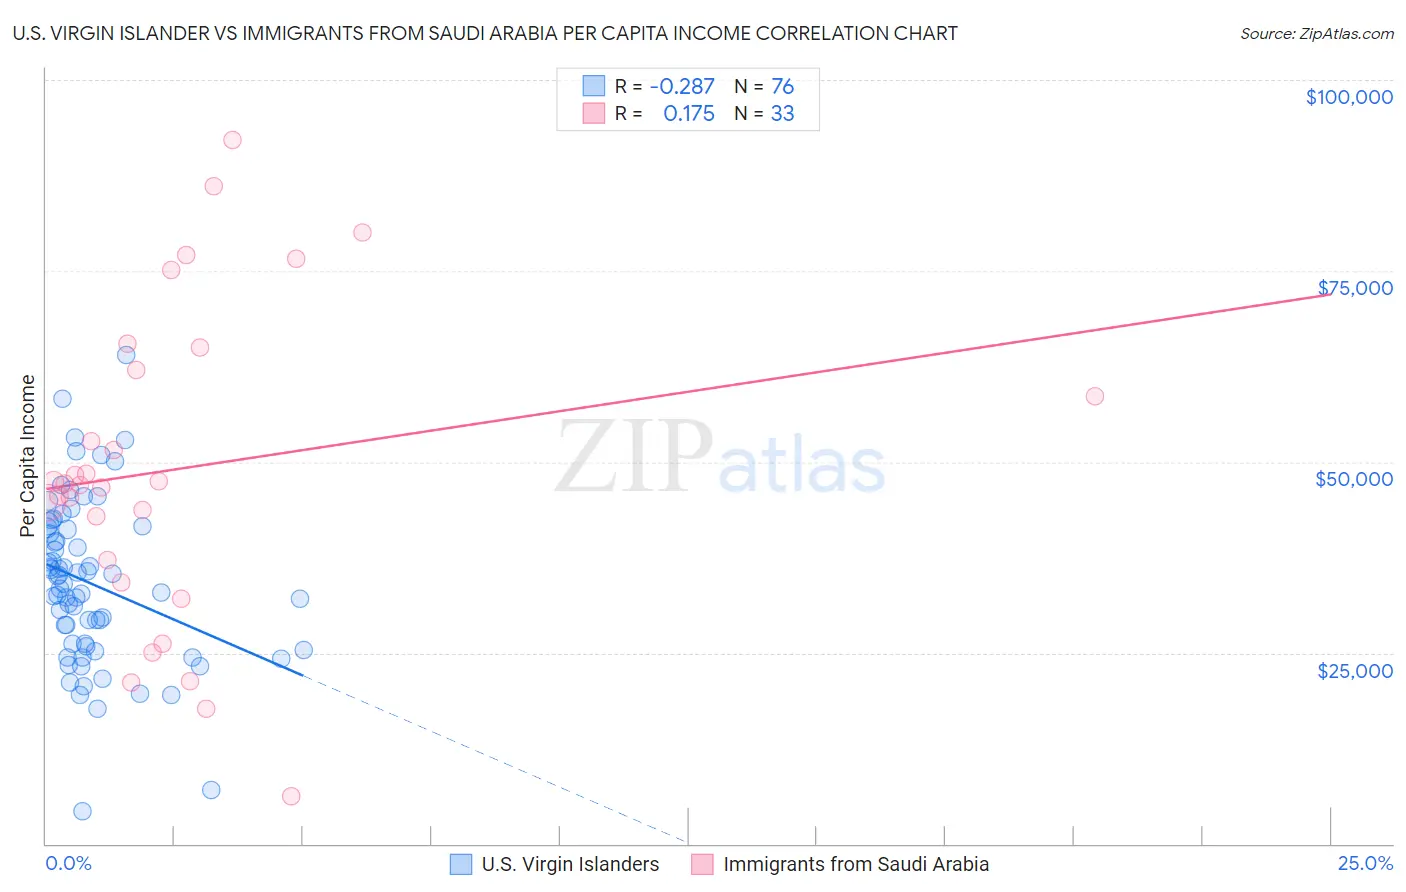
U.S. Virgin Islander vs Immigrants from Saudi Arabia Per Capita Income Correlation Chart
The statistical analysis conducted on geographies consisting of 87,529,979 people shows a weak negative correlation between the proportion of U.S. Virgin Islanders and per capita income in the United States with a correlation coefficient (R) of -0.287 and weighted average of $37,589. Similarly, the statistical analysis conducted on geographies consisting of 164,297,329 people shows a poor positive correlation between the proportion of Immigrants from Saudi Arabia and per capita income in the United States with a correlation coefficient (R) of 0.175 and weighted average of $46,008, a difference of 22.4%.
Per Capita Income Correlation Summary
| Measurement | U.S. Virgin Islander | Immigrants from Saudi Arabia |
| Minimum | $4,326 | $6,252 |
| Maximum | $64,008 | $92,098 |
| Range | $59,682 | $85,846 |
| Mean | $34,023 | $49,029 |
| Median | $33,782 | $47,113 |
| Interquartile 25% (IQ1) | $26,044 | $35,703 |
| Interquartile 75% (IQ3) | $41,286 | $63,528 |
| Interquartile Range (IQR) | $15,242 | $27,825 |
| Standard Deviation (Sample) | $10,800 | $20,510 |
| Standard Deviation (Population) | $10,729 | $20,197 |
Similar Demographics by Per Capita Income
Demographics Similar to U.S. Virgin Islanders by Per Capita Income
In terms of per capita income, the demographic groups most similar to U.S. Virgin Islanders are Immigrants from Guatemala ($37,550, a difference of 0.10%), Cajun ($37,527, a difference of 0.16%), Blackfeet ($37,695, a difference of 0.28%), Central American Indian ($37,699, a difference of 0.29%), and Dominican ($37,697, a difference of 0.29%).
| Demographics | Rating | Rank | Per Capita Income |
| Immigrants | Laos | 0.1 /100 | #282 | Tragic $37,857 |
| Pennsylvania Germans | 0.1 /100 | #283 | Tragic $37,842 |
| Africans | 0.1 /100 | #284 | Tragic $37,785 |
| Guatemalans | 0.1 /100 | #285 | Tragic $37,766 |
| Central American Indians | 0.1 /100 | #286 | Tragic $37,699 |
| Dominicans | 0.1 /100 | #287 | Tragic $37,697 |
| Blackfeet | 0.1 /100 | #288 | Tragic $37,695 |
| U.S. Virgin Islanders | 0.1 /100 | #289 | Tragic $37,589 |
| Immigrants | Guatemala | 0.1 /100 | #290 | Tragic $37,550 |
| Cajuns | 0.1 /100 | #291 | Tragic $37,527 |
| Immigrants | Micronesia | 0.1 /100 | #292 | Tragic $37,464 |
| Mexican American Indians | 0.1 /100 | #293 | Tragic $37,407 |
| Cubans | 0.1 /100 | #294 | Tragic $37,383 |
| Immigrants | Dominican Republic | 0.1 /100 | #295 | Tragic $37,306 |
| Indonesians | 0.1 /100 | #296 | Tragic $37,300 |
Demographics Similar to Immigrants from Saudi Arabia by Per Capita Income
In terms of per capita income, the demographic groups most similar to Immigrants from Saudi Arabia are Immigrants from Poland ($45,979, a difference of 0.060%), Chinese ($46,098, a difference of 0.19%), Immigrants from Ethiopia ($45,923, a difference of 0.19%), Polish ($46,123, a difference of 0.25%), and Canadian ($45,858, a difference of 0.33%).
| Demographics | Rating | Rank | Per Capita Income |
| Taiwanese | 95.8 /100 | #111 | Exceptional $46,455 |
| Immigrants | Morocco | 95.7 /100 | #112 | Exceptional $46,430 |
| Immigrants | Albania | 95.5 /100 | #113 | Exceptional $46,387 |
| Afghans | 94.9 /100 | #114 | Exceptional $46,268 |
| Immigrants | Chile | 94.6 /100 | #115 | Exceptional $46,213 |
| Poles | 94.1 /100 | #116 | Exceptional $46,123 |
| Chinese | 93.9 /100 | #117 | Exceptional $46,098 |
| Immigrants | Saudi Arabia | 93.3 /100 | #118 | Exceptional $46,008 |
| Immigrants | Poland | 93.1 /100 | #119 | Exceptional $45,979 |
| Immigrants | Ethiopia | 92.7 /100 | #120 | Exceptional $45,923 |
| Canadians | 92.2 /100 | #121 | Exceptional $45,858 |
| Moroccans | 92.1 /100 | #122 | Exceptional $45,854 |
| Lebanese | 92.0 /100 | #123 | Exceptional $45,840 |
| Europeans | 92.0 /100 | #124 | Exceptional $45,836 |
| Zimbabweans | 91.7 /100 | #125 | Exceptional $45,804 |