Immigrants from Eastern Asia vs Immigrants from Saudi Arabia Per Capita Income
COMPARE
Immigrants from Eastern Asia
Immigrants from Saudi Arabia
Per Capita Income
Per Capita Income Comparison
Immigrants from Eastern Asia
Immigrants from Saudi Arabia
$53,806
PER CAPITA INCOME
100.0/ 100
METRIC RATING
23rd/ 347
METRIC RANK
$46,008
PER CAPITA INCOME
93.3/ 100
METRIC RATING
118th/ 347
METRIC RANK
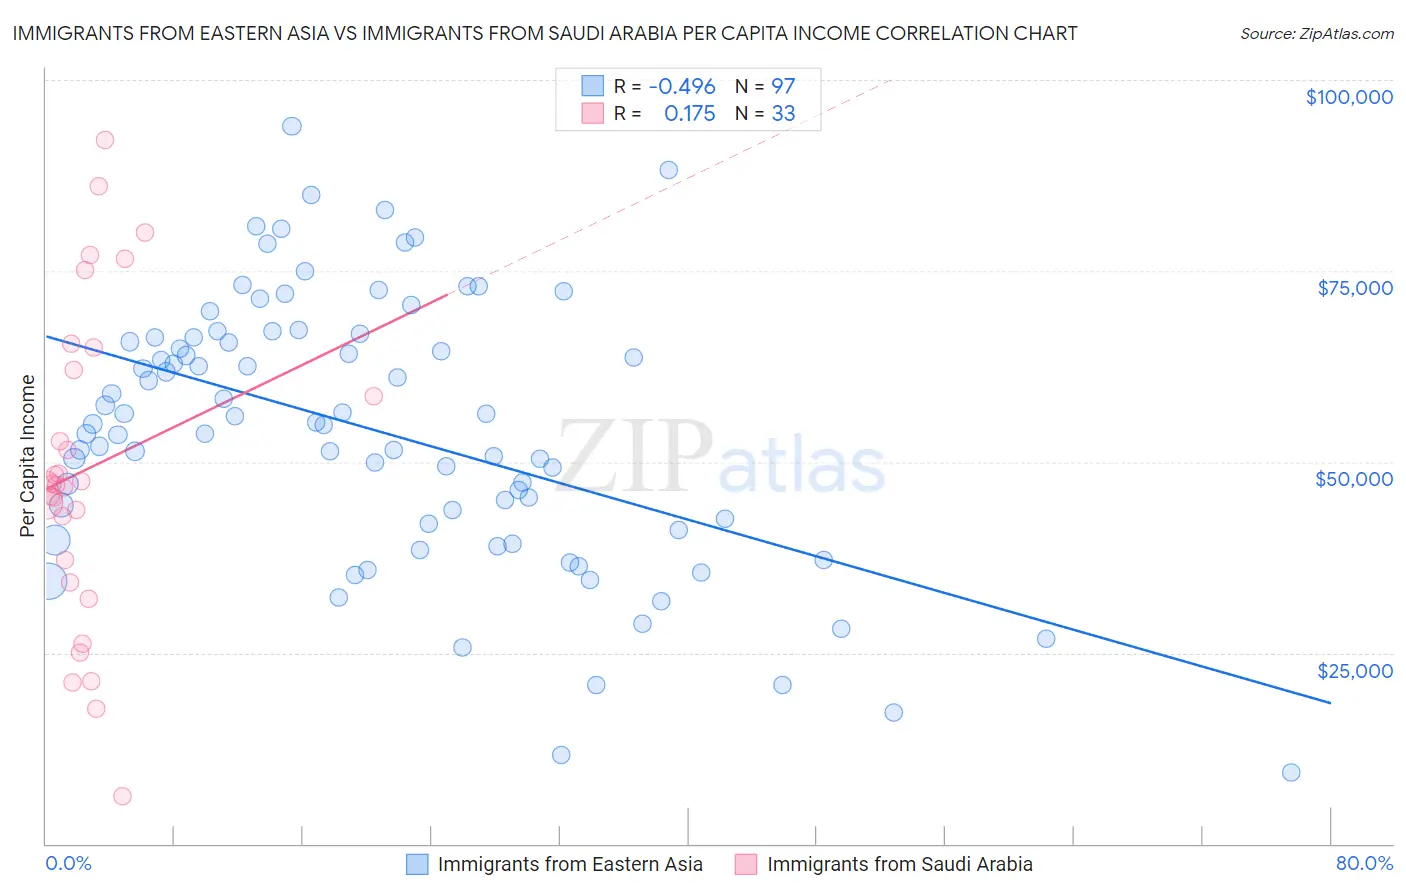
Immigrants from Eastern Asia vs Immigrants from Saudi Arabia Per Capita Income Correlation Chart
The statistical analysis conducted on geographies consisting of 499,991,625 people shows a moderate negative correlation between the proportion of Immigrants from Eastern Asia and per capita income in the United States with a correlation coefficient (R) of -0.496 and weighted average of $53,806. Similarly, the statistical analysis conducted on geographies consisting of 164,297,329 people shows a poor positive correlation between the proportion of Immigrants from Saudi Arabia and per capita income in the United States with a correlation coefficient (R) of 0.175 and weighted average of $46,008, a difference of 17.0%.
Per Capita Income Correlation Summary
| Measurement | Immigrants from Eastern Asia | Immigrants from Saudi Arabia |
| Minimum | $9,290 | $6,252 |
| Maximum | $93,950 | $92,098 |
| Range | $84,660 | $85,846 |
| Mean | $54,065 | $49,029 |
| Median | $54,919 | $47,113 |
| Interquartile 25% (IQ1) | $41,457 | $35,703 |
| Interquartile 75% (IQ3) | $66,275 | $63,528 |
| Interquartile Range (IQR) | $24,818 | $27,825 |
| Standard Deviation (Sample) | $17,495 | $20,510 |
| Standard Deviation (Population) | $17,405 | $20,197 |
Similar Demographics by Per Capita Income
Demographics Similar to Immigrants from Eastern Asia by Per Capita Income
In terms of per capita income, the demographic groups most similar to Immigrants from Eastern Asia are Immigrants from Denmark ($53,799, a difference of 0.010%), Indian (Asian) ($53,874, a difference of 0.13%), Immigrants from Northern Europe ($54,159, a difference of 0.66%), Soviet Union ($54,202, a difference of 0.74%), and Immigrants from Japan ($53,359, a difference of 0.84%).
| Demographics | Rating | Rank | Per Capita Income |
| Immigrants | Switzerland | 100.0 /100 | #16 | Exceptional $54,866 |
| Immigrants | France | 100.0 /100 | #17 | Exceptional $54,557 |
| Thais | 100.0 /100 | #18 | Exceptional $54,307 |
| Immigrants | China | 100.0 /100 | #19 | Exceptional $54,264 |
| Soviet Union | 100.0 /100 | #20 | Exceptional $54,202 |
| Immigrants | Northern Europe | 100.0 /100 | #21 | Exceptional $54,159 |
| Indians (Asian) | 100.0 /100 | #22 | Exceptional $53,874 |
| Immigrants | Eastern Asia | 100.0 /100 | #23 | Exceptional $53,806 |
| Immigrants | Denmark | 100.0 /100 | #24 | Exceptional $53,799 |
| Immigrants | Japan | 100.0 /100 | #25 | Exceptional $53,359 |
| Russians | 100.0 /100 | #26 | Exceptional $53,154 |
| Immigrants | South Central Asia | 100.0 /100 | #27 | Exceptional $52,660 |
| Latvians | 100.0 /100 | #28 | Exceptional $52,649 |
| Israelis | 100.0 /100 | #29 | Exceptional $52,596 |
| Immigrants | Austria | 100.0 /100 | #30 | Exceptional $52,503 |
Demographics Similar to Immigrants from Saudi Arabia by Per Capita Income
In terms of per capita income, the demographic groups most similar to Immigrants from Saudi Arabia are Immigrants from Poland ($45,979, a difference of 0.060%), Chinese ($46,098, a difference of 0.19%), Immigrants from Ethiopia ($45,923, a difference of 0.19%), Polish ($46,123, a difference of 0.25%), and Canadian ($45,858, a difference of 0.33%).
| Demographics | Rating | Rank | Per Capita Income |
| Taiwanese | 95.8 /100 | #111 | Exceptional $46,455 |
| Immigrants | Morocco | 95.7 /100 | #112 | Exceptional $46,430 |
| Immigrants | Albania | 95.5 /100 | #113 | Exceptional $46,387 |
| Afghans | 94.9 /100 | #114 | Exceptional $46,268 |
| Immigrants | Chile | 94.6 /100 | #115 | Exceptional $46,213 |
| Poles | 94.1 /100 | #116 | Exceptional $46,123 |
| Chinese | 93.9 /100 | #117 | Exceptional $46,098 |
| Immigrants | Saudi Arabia | 93.3 /100 | #118 | Exceptional $46,008 |
| Immigrants | Poland | 93.1 /100 | #119 | Exceptional $45,979 |
| Immigrants | Ethiopia | 92.7 /100 | #120 | Exceptional $45,923 |
| Canadians | 92.2 /100 | #121 | Exceptional $45,858 |
| Moroccans | 92.1 /100 | #122 | Exceptional $45,854 |
| Lebanese | 92.0 /100 | #123 | Exceptional $45,840 |
| Europeans | 92.0 /100 | #124 | Exceptional $45,836 |
| Zimbabweans | 91.7 /100 | #125 | Exceptional $45,804 |