Polish vs Immigrants from Ghana Per Capita Income
COMPARE
Polish
Immigrants from Ghana
Per Capita Income
Per Capita Income Comparison
Poles
Immigrants from Ghana
$46,123
PER CAPITA INCOME
94.1/ 100
METRIC RATING
116th/ 347
METRIC RANK
$41,131
PER CAPITA INCOME
5.5/ 100
METRIC RATING
227th/ 347
METRIC RANK
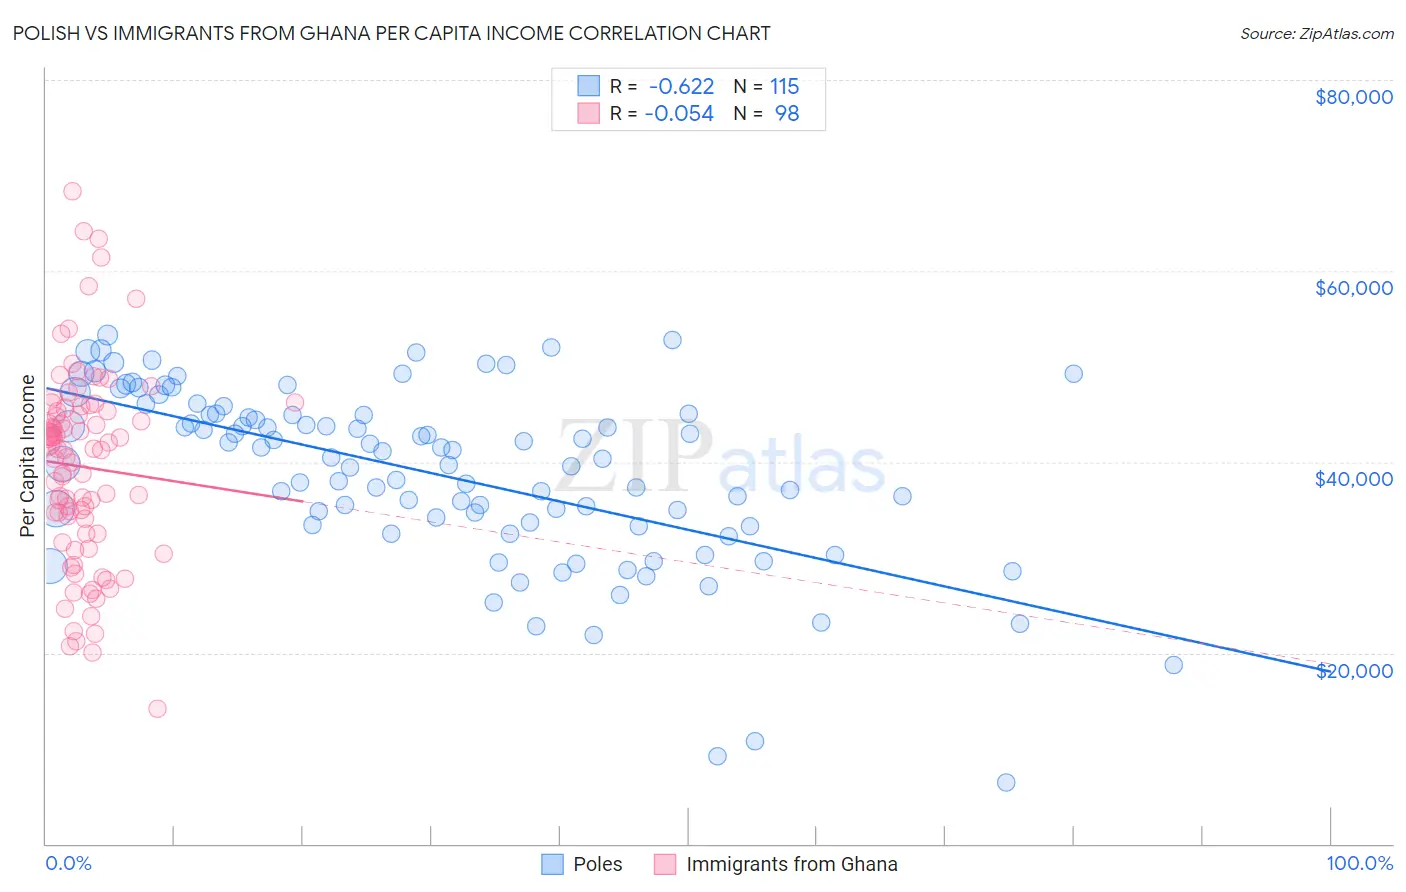
Polish vs Immigrants from Ghana Per Capita Income Correlation Chart
The statistical analysis conducted on geographies consisting of 560,657,396 people shows a significant negative correlation between the proportion of Poles and per capita income in the United States with a correlation coefficient (R) of -0.622 and weighted average of $46,123. Similarly, the statistical analysis conducted on geographies consisting of 199,964,611 people shows a slight negative correlation between the proportion of Immigrants from Ghana and per capita income in the United States with a correlation coefficient (R) of -0.054 and weighted average of $41,131, a difference of 12.1%.
Per Capita Income Correlation Summary
| Measurement | Polish | Immigrants from Ghana |
| Minimum | $6,461 | $14,179 |
| Maximum | $53,317 | $68,358 |
| Range | $46,856 | $54,179 |
| Mean | $38,750 | $39,490 |
| Median | $40,450 | $41,313 |
| Interquartile 25% (IQ1) | $33,437 | $32,441 |
| Interquartile 75% (IQ3) | $44,990 | $45,276 |
| Interquartile Range (IQR) | $11,553 | $12,835 |
| Standard Deviation (Sample) | $9,315 | $10,193 |
| Standard Deviation (Population) | $9,274 | $10,141 |
Similar Demographics by Per Capita Income
Demographics Similar to Poles by Per Capita Income
In terms of per capita income, the demographic groups most similar to Poles are Chinese ($46,098, a difference of 0.050%), Immigrants from Chile ($46,213, a difference of 0.20%), Immigrants from Saudi Arabia ($46,008, a difference of 0.25%), Immigrants from Poland ($45,979, a difference of 0.31%), and Afghan ($46,268, a difference of 0.32%).
| Demographics | Rating | Rank | Per Capita Income |
| Immigrants | Northern Africa | 96.2 /100 | #109 | Exceptional $46,531 |
| Chileans | 95.9 /100 | #110 | Exceptional $46,459 |
| Taiwanese | 95.8 /100 | #111 | Exceptional $46,455 |
| Immigrants | Morocco | 95.7 /100 | #112 | Exceptional $46,430 |
| Immigrants | Albania | 95.5 /100 | #113 | Exceptional $46,387 |
| Afghans | 94.9 /100 | #114 | Exceptional $46,268 |
| Immigrants | Chile | 94.6 /100 | #115 | Exceptional $46,213 |
| Poles | 94.1 /100 | #116 | Exceptional $46,123 |
| Chinese | 93.9 /100 | #117 | Exceptional $46,098 |
| Immigrants | Saudi Arabia | 93.3 /100 | #118 | Exceptional $46,008 |
| Immigrants | Poland | 93.1 /100 | #119 | Exceptional $45,979 |
| Immigrants | Ethiopia | 92.7 /100 | #120 | Exceptional $45,923 |
| Canadians | 92.2 /100 | #121 | Exceptional $45,858 |
| Moroccans | 92.1 /100 | #122 | Exceptional $45,854 |
| Lebanese | 92.0 /100 | #123 | Exceptional $45,840 |
Demographics Similar to Immigrants from Ghana by Per Capita Income
In terms of per capita income, the demographic groups most similar to Immigrants from Ghana are Immigrants from Grenada ($41,123, a difference of 0.020%), Immigrants from Ecuador ($41,195, a difference of 0.16%), West Indian ($41,217, a difference of 0.21%), Nigerian ($41,026, a difference of 0.26%), and Native Hawaiian ($41,017, a difference of 0.28%).
| Demographics | Rating | Rank | Per Capita Income |
| Immigrants | Barbados | 7.9 /100 | #220 | Tragic $41,478 |
| Immigrants | Trinidad and Tobago | 7.9 /100 | #221 | Tragic $41,476 |
| Immigrants | Iraq | 7.1 /100 | #222 | Tragic $41,365 |
| Immigrants | Cameroon | 6.8 /100 | #223 | Tragic $41,334 |
| Immigrants | St. Vincent and the Grenadines | 6.4 /100 | #224 | Tragic $41,270 |
| West Indians | 6.0 /100 | #225 | Tragic $41,217 |
| Immigrants | Ecuador | 5.9 /100 | #226 | Tragic $41,195 |
| Immigrants | Ghana | 5.5 /100 | #227 | Tragic $41,131 |
| Immigrants | Grenada | 5.5 /100 | #228 | Tragic $41,123 |
| Nigerians | 4.9 /100 | #229 | Tragic $41,026 |
| Native Hawaiians | 4.9 /100 | #230 | Tragic $41,017 |
| Senegalese | 4.8 /100 | #231 | Tragic $41,000 |
| Guyanese | 4.5 /100 | #232 | Tragic $40,949 |
| Delaware | 3.8 /100 | #233 | Tragic $40,778 |
| Immigrants | West Indies | 3.7 /100 | #234 | Tragic $40,763 |