Polish vs Immigrants from Oceania Per Capita Income
COMPARE
Polish
Immigrants from Oceania
Per Capita Income
Per Capita Income Comparison
Poles
Immigrants from Oceania
$46,123
PER CAPITA INCOME
94.1/ 100
METRIC RATING
116th/ 347
METRIC RANK
$45,220
PER CAPITA INCOME
85.2/ 100
METRIC RATING
136th/ 347
METRIC RANK
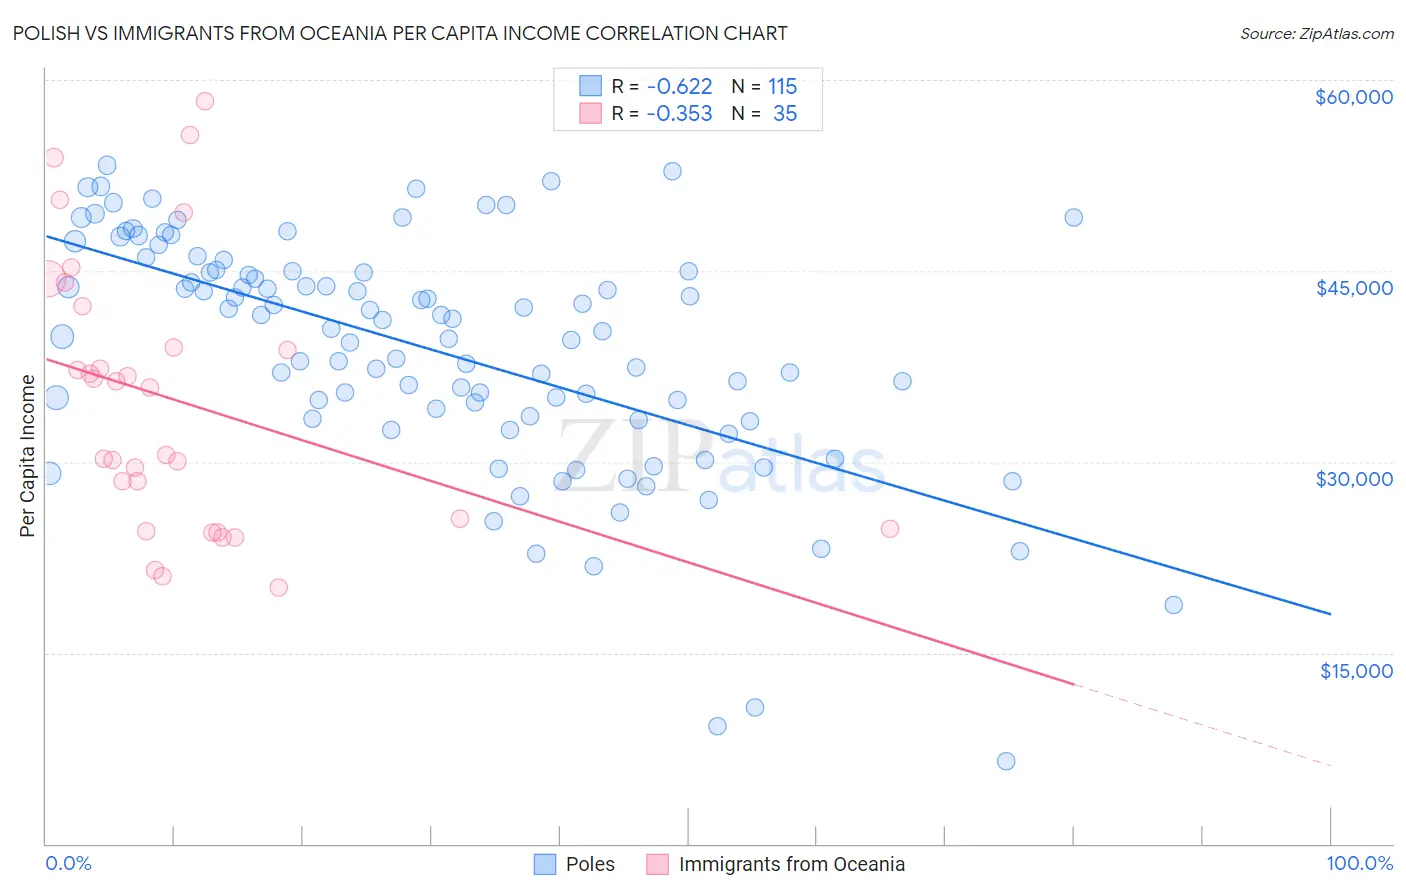
Polish vs Immigrants from Oceania Per Capita Income Correlation Chart
The statistical analysis conducted on geographies consisting of 560,657,396 people shows a significant negative correlation between the proportion of Poles and per capita income in the United States with a correlation coefficient (R) of -0.622 and weighted average of $46,123. Similarly, the statistical analysis conducted on geographies consisting of 305,528,367 people shows a mild negative correlation between the proportion of Immigrants from Oceania and per capita income in the United States with a correlation coefficient (R) of -0.353 and weighted average of $45,220, a difference of 2.0%.
Per Capita Income Correlation Summary
| Measurement | Polish | Immigrants from Oceania |
| Minimum | $6,461 | $20,128 |
| Maximum | $53,317 | $58,378 |
| Range | $46,856 | $38,250 |
| Mean | $38,750 | $34,877 |
| Median | $40,450 | $35,881 |
| Interquartile 25% (IQ1) | $33,437 | $24,699 |
| Interquartile 75% (IQ3) | $44,990 | $42,218 |
| Interquartile Range (IQR) | $11,553 | $17,519 |
| Standard Deviation (Sample) | $9,315 | $10,480 |
| Standard Deviation (Population) | $9,274 | $10,330 |
Demographics Similar to Poles and Immigrants from Oceania by Per Capita Income
In terms of per capita income, the demographic groups most similar to Poles are Chinese ($46,098, a difference of 0.050%), Immigrants from Saudi Arabia ($46,008, a difference of 0.25%), Immigrants from Poland ($45,979, a difference of 0.31%), Immigrants from Ethiopia ($45,923, a difference of 0.43%), and Canadian ($45,858, a difference of 0.58%). Similarly, the demographic groups most similar to Immigrants from Oceania are Hungarian ($45,426, a difference of 0.46%), Slovene ($45,581, a difference of 0.80%), Pakistani ($45,587, a difference of 0.81%), Jordanian ($45,605, a difference of 0.85%), and Immigrants from North Macedonia ($45,622, a difference of 0.89%).
| Demographics | Rating | Rank | Per Capita Income |
| Poles | 94.1 /100 | #116 | Exceptional $46,123 |
| Chinese | 93.9 /100 | #117 | Exceptional $46,098 |
| Immigrants | Saudi Arabia | 93.3 /100 | #118 | Exceptional $46,008 |
| Immigrants | Poland | 93.1 /100 | #119 | Exceptional $45,979 |
| Immigrants | Ethiopia | 92.7 /100 | #120 | Exceptional $45,923 |
| Canadians | 92.2 /100 | #121 | Exceptional $45,858 |
| Moroccans | 92.1 /100 | #122 | Exceptional $45,854 |
| Lebanese | 92.0 /100 | #123 | Exceptional $45,840 |
| Europeans | 92.0 /100 | #124 | Exceptional $45,836 |
| Zimbabweans | 91.7 /100 | #125 | Exceptional $45,804 |
| Palestinians | 91.6 /100 | #126 | Exceptional $45,790 |
| Immigrants | Germany | 91.3 /100 | #127 | Exceptional $45,751 |
| Swedes | 91.3 /100 | #128 | Exceptional $45,750 |
| Luxembourgers | 90.4 /100 | #129 | Exceptional $45,663 |
| Arabs | 90.4 /100 | #130 | Exceptional $45,662 |
| Immigrants | North Macedonia | 90.0 /100 | #131 | Exceptional $45,622 |
| Jordanians | 89.9 /100 | #132 | Excellent $45,605 |
| Pakistanis | 89.7 /100 | #133 | Excellent $45,587 |
| Slovenes | 89.6 /100 | #134 | Excellent $45,581 |
| Hungarians | 87.9 /100 | #135 | Excellent $45,426 |
| Immigrants | Oceania | 85.2 /100 | #136 | Excellent $45,220 |