Polish vs Immigrants from Turkey Per Capita Income
COMPARE
Polish
Immigrants from Turkey
Per Capita Income
Per Capita Income Comparison
Poles
Immigrants from Turkey
$46,123
PER CAPITA INCOME
94.1/ 100
METRIC RATING
116th/ 347
METRIC RANK
$51,368
PER CAPITA INCOME
100.0/ 100
METRIC RATING
42nd/ 347
METRIC RANK
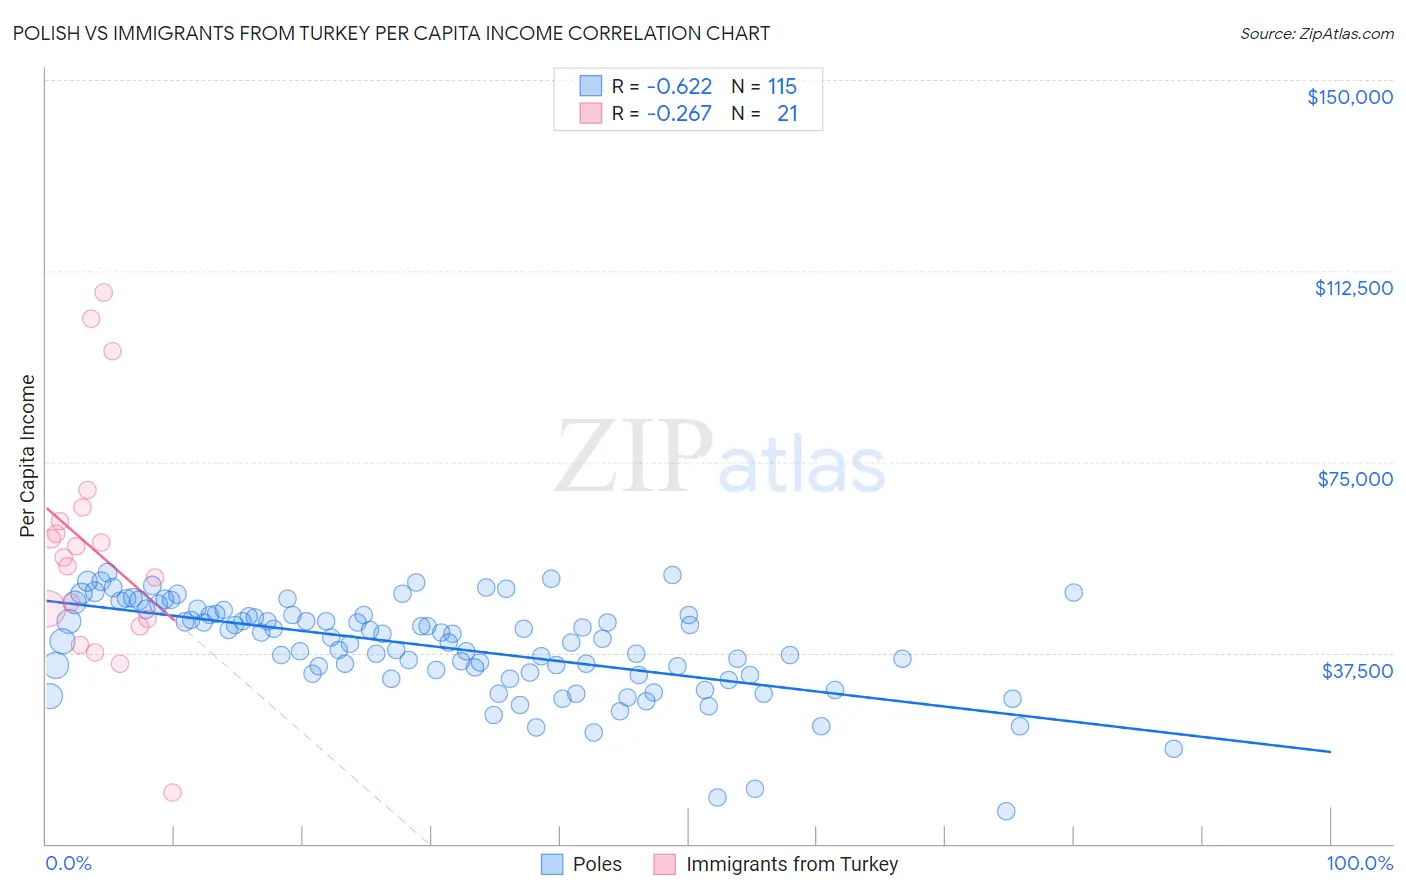
Polish vs Immigrants from Turkey Per Capita Income Correlation Chart
The statistical analysis conducted on geographies consisting of 560,657,396 people shows a significant negative correlation between the proportion of Poles and per capita income in the United States with a correlation coefficient (R) of -0.622 and weighted average of $46,123. Similarly, the statistical analysis conducted on geographies consisting of 223,057,840 people shows a weak negative correlation between the proportion of Immigrants from Turkey and per capita income in the United States with a correlation coefficient (R) of -0.267 and weighted average of $51,368, a difference of 11.4%.
Per Capita Income Correlation Summary
| Measurement | Polish | Immigrants from Turkey |
| Minimum | $6,461 | $10,156 |
| Maximum | $53,317 | $108,195 |
| Range | $46,856 | $98,039 |
| Mean | $38,750 | $57,681 |
| Median | $40,450 | $56,181 |
| Interquartile 25% (IQ1) | $33,437 | $43,465 |
| Interquartile 75% (IQ3) | $44,990 | $64,694 |
| Interquartile Range (IQR) | $11,553 | $21,229 |
| Standard Deviation (Sample) | $9,315 | $23,007 |
| Standard Deviation (Population) | $9,274 | $22,452 |
Similar Demographics by Per Capita Income
Demographics Similar to Poles by Per Capita Income
In terms of per capita income, the demographic groups most similar to Poles are Chinese ($46,098, a difference of 0.050%), Immigrants from Chile ($46,213, a difference of 0.20%), Immigrants from Saudi Arabia ($46,008, a difference of 0.25%), Immigrants from Poland ($45,979, a difference of 0.31%), and Afghan ($46,268, a difference of 0.32%).
| Demographics | Rating | Rank | Per Capita Income |
| Immigrants | Northern Africa | 96.2 /100 | #109 | Exceptional $46,531 |
| Chileans | 95.9 /100 | #110 | Exceptional $46,459 |
| Taiwanese | 95.8 /100 | #111 | Exceptional $46,455 |
| Immigrants | Morocco | 95.7 /100 | #112 | Exceptional $46,430 |
| Immigrants | Albania | 95.5 /100 | #113 | Exceptional $46,387 |
| Afghans | 94.9 /100 | #114 | Exceptional $46,268 |
| Immigrants | Chile | 94.6 /100 | #115 | Exceptional $46,213 |
| Poles | 94.1 /100 | #116 | Exceptional $46,123 |
| Chinese | 93.9 /100 | #117 | Exceptional $46,098 |
| Immigrants | Saudi Arabia | 93.3 /100 | #118 | Exceptional $46,008 |
| Immigrants | Poland | 93.1 /100 | #119 | Exceptional $45,979 |
| Immigrants | Ethiopia | 92.7 /100 | #120 | Exceptional $45,923 |
| Canadians | 92.2 /100 | #121 | Exceptional $45,858 |
| Moroccans | 92.1 /100 | #122 | Exceptional $45,854 |
| Lebanese | 92.0 /100 | #123 | Exceptional $45,840 |
Demographics Similar to Immigrants from Turkey by Per Capita Income
In terms of per capita income, the demographic groups most similar to Immigrants from Turkey are Immigrants from Lithuania ($51,361, a difference of 0.010%), Immigrants from South Africa ($51,465, a difference of 0.19%), Immigrants from Korea ($51,671, a difference of 0.59%), Cambodian ($51,731, a difference of 0.71%), and Immigrants from Czechoslovakia ($51,770, a difference of 0.78%).
| Demographics | Rating | Rank | Per Capita Income |
| Burmese | 100.0 /100 | #35 | Exceptional $52,005 |
| Immigrants | Greece | 100.0 /100 | #36 | Exceptional $51,891 |
| Estonians | 100.0 /100 | #37 | Exceptional $51,875 |
| Immigrants | Czechoslovakia | 100.0 /100 | #38 | Exceptional $51,770 |
| Cambodians | 100.0 /100 | #39 | Exceptional $51,731 |
| Immigrants | Korea | 100.0 /100 | #40 | Exceptional $51,671 |
| Immigrants | South Africa | 100.0 /100 | #41 | Exceptional $51,465 |
| Immigrants | Turkey | 100.0 /100 | #42 | Exceptional $51,368 |
| Immigrants | Lithuania | 100.0 /100 | #43 | Exceptional $51,361 |
| Immigrants | Europe | 100.0 /100 | #44 | Exceptional $50,950 |
| Immigrants | Spain | 100.0 /100 | #45 | Exceptional $50,933 |
| Immigrants | Latvia | 100.0 /100 | #46 | Exceptional $50,914 |
| Bulgarians | 100.0 /100 | #47 | Exceptional $50,906 |
| Immigrants | Serbia | 100.0 /100 | #48 | Exceptional $50,810 |
| New Zealanders | 100.0 /100 | #49 | Exceptional $50,575 |