Immigrants from West Indies vs Immigrants from Saudi Arabia Per Capita Income
COMPARE
Immigrants from West Indies
Immigrants from Saudi Arabia
Per Capita Income
Per Capita Income Comparison
Immigrants from West Indies
Immigrants from Saudi Arabia
$40,763
PER CAPITA INCOME
3.7/ 100
METRIC RATING
234th/ 347
METRIC RANK
$46,008
PER CAPITA INCOME
93.3/ 100
METRIC RATING
118th/ 347
METRIC RANK
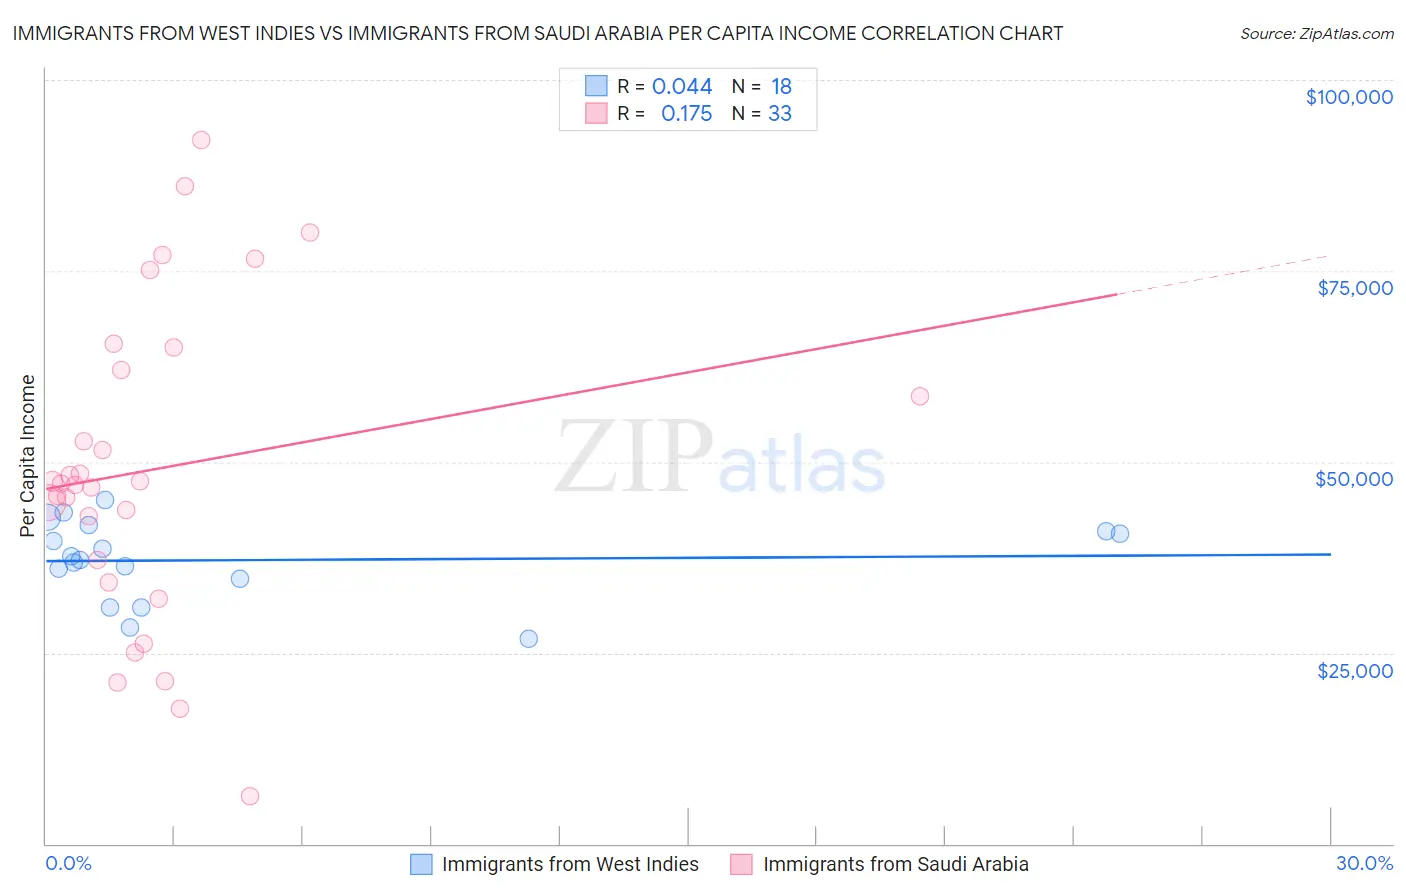
Immigrants from West Indies vs Immigrants from Saudi Arabia Per Capita Income Correlation Chart
The statistical analysis conducted on geographies consisting of 72,420,477 people shows no correlation between the proportion of Immigrants from West Indies and per capita income in the United States with a correlation coefficient (R) of 0.044 and weighted average of $40,763. Similarly, the statistical analysis conducted on geographies consisting of 164,297,329 people shows a poor positive correlation between the proportion of Immigrants from Saudi Arabia and per capita income in the United States with a correlation coefficient (R) of 0.175 and weighted average of $46,008, a difference of 12.9%.
Per Capita Income Correlation Summary
| Measurement | Immigrants from West Indies | Immigrants from Saudi Arabia |
| Minimum | $26,894 | $6,252 |
| Maximum | $45,008 | $92,098 |
| Range | $18,114 | $85,846 |
| Mean | $37,133 | $49,029 |
| Median | $37,421 | $47,113 |
| Interquartile 25% (IQ1) | $34,659 | $35,703 |
| Interquartile 75% (IQ3) | $40,860 | $63,528 |
| Interquartile Range (IQR) | $6,201 | $27,825 |
| Standard Deviation (Sample) | $5,188 | $20,510 |
| Standard Deviation (Population) | $5,042 | $20,197 |
Similar Demographics by Per Capita Income
Demographics Similar to Immigrants from West Indies by Per Capita Income
In terms of per capita income, the demographic groups most similar to Immigrants from West Indies are Delaware ($40,778, a difference of 0.040%), Immigrants from Guyana ($40,742, a difference of 0.050%), Nonimmigrants ($40,669, a difference of 0.23%), Guyanese ($40,949, a difference of 0.46%), and Senegalese ($41,000, a difference of 0.58%).
| Demographics | Rating | Rank | Per Capita Income |
| Immigrants | Ghana | 5.5 /100 | #227 | Tragic $41,131 |
| Immigrants | Grenada | 5.5 /100 | #228 | Tragic $41,123 |
| Nigerians | 4.9 /100 | #229 | Tragic $41,026 |
| Native Hawaiians | 4.9 /100 | #230 | Tragic $41,017 |
| Senegalese | 4.8 /100 | #231 | Tragic $41,000 |
| Guyanese | 4.5 /100 | #232 | Tragic $40,949 |
| Delaware | 3.8 /100 | #233 | Tragic $40,778 |
| Immigrants | West Indies | 3.7 /100 | #234 | Tragic $40,763 |
| Immigrants | Guyana | 3.6 /100 | #235 | Tragic $40,742 |
| Immigrants | Nonimmigrants | 3.4 /100 | #236 | Tragic $40,669 |
| Immigrants | Cambodia | 2.6 /100 | #237 | Tragic $40,434 |
| Somalis | 2.4 /100 | #238 | Tragic $40,367 |
| Tsimshian | 2.4 /100 | #239 | Tragic $40,344 |
| Immigrants | Nigeria | 2.3 /100 | #240 | Tragic $40,339 |
| British West Indians | 2.3 /100 | #241 | Tragic $40,330 |
Demographics Similar to Immigrants from Saudi Arabia by Per Capita Income
In terms of per capita income, the demographic groups most similar to Immigrants from Saudi Arabia are Immigrants from Poland ($45,979, a difference of 0.060%), Chinese ($46,098, a difference of 0.19%), Immigrants from Ethiopia ($45,923, a difference of 0.19%), Polish ($46,123, a difference of 0.25%), and Canadian ($45,858, a difference of 0.33%).
| Demographics | Rating | Rank | Per Capita Income |
| Taiwanese | 95.8 /100 | #111 | Exceptional $46,455 |
| Immigrants | Morocco | 95.7 /100 | #112 | Exceptional $46,430 |
| Immigrants | Albania | 95.5 /100 | #113 | Exceptional $46,387 |
| Afghans | 94.9 /100 | #114 | Exceptional $46,268 |
| Immigrants | Chile | 94.6 /100 | #115 | Exceptional $46,213 |
| Poles | 94.1 /100 | #116 | Exceptional $46,123 |
| Chinese | 93.9 /100 | #117 | Exceptional $46,098 |
| Immigrants | Saudi Arabia | 93.3 /100 | #118 | Exceptional $46,008 |
| Immigrants | Poland | 93.1 /100 | #119 | Exceptional $45,979 |
| Immigrants | Ethiopia | 92.7 /100 | #120 | Exceptional $45,923 |
| Canadians | 92.2 /100 | #121 | Exceptional $45,858 |
| Moroccans | 92.1 /100 | #122 | Exceptional $45,854 |
| Lebanese | 92.0 /100 | #123 | Exceptional $45,840 |
| Europeans | 92.0 /100 | #124 | Exceptional $45,836 |
| Zimbabweans | 91.7 /100 | #125 | Exceptional $45,804 |