Polish vs Immigrants from Argentina Median Household Income
COMPARE
Polish
Immigrants from Argentina
Median Household Income
Median Household Income Comparison
Poles
Immigrants from Argentina
$88,472
MEDIAN HOUSEHOLD INCOME
89.7/ 100
METRIC RATING
136th/ 347
METRIC RANK
$92,417
MEDIAN HOUSEHOLD INCOME
99.1/ 100
METRIC RATING
84th/ 347
METRIC RANK
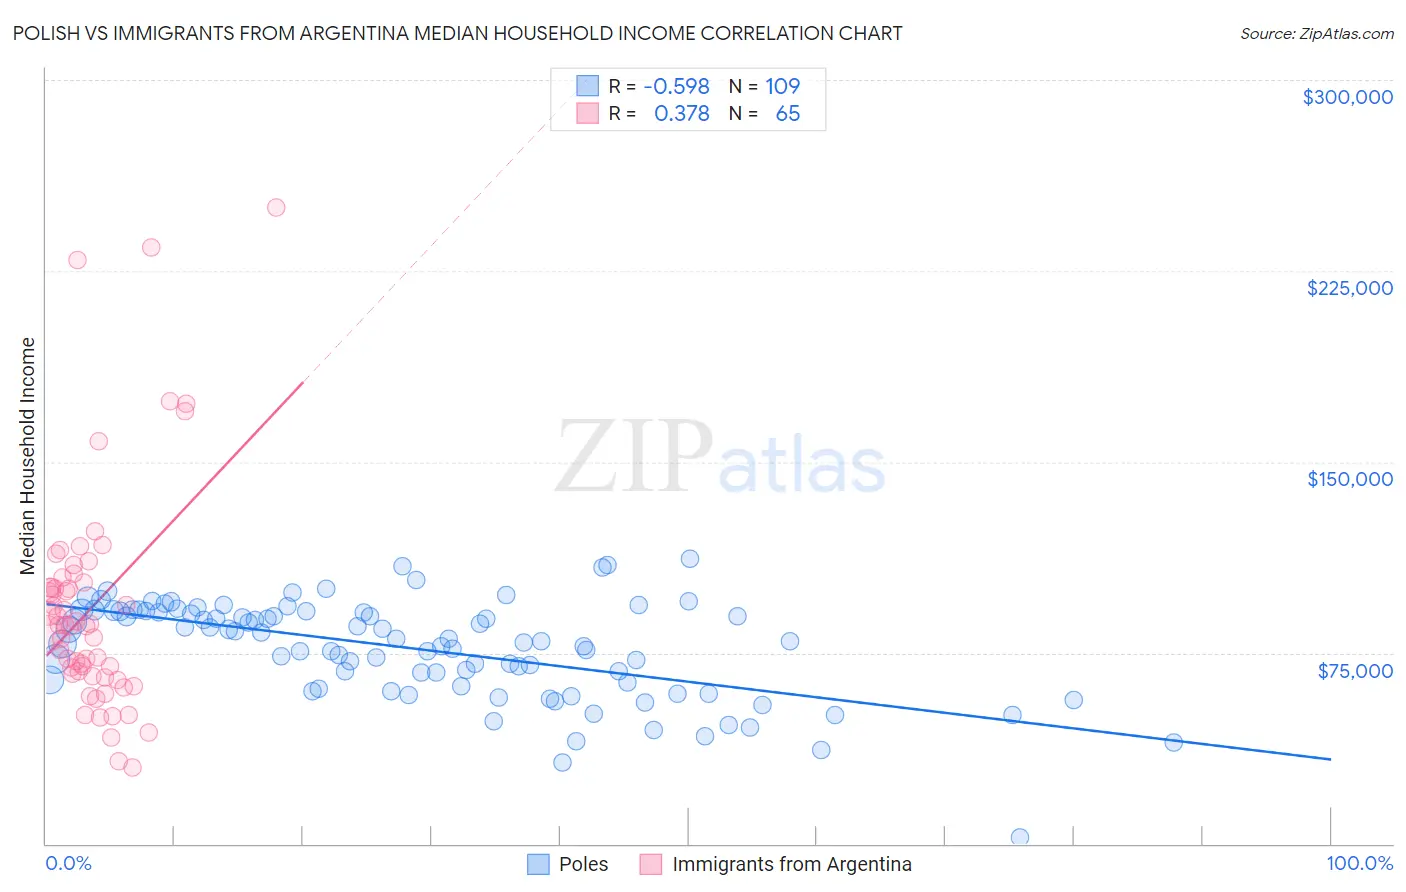
Polish vs Immigrants from Argentina Median Household Income Correlation Chart
The statistical analysis conducted on geographies consisting of 559,571,407 people shows a substantial negative correlation between the proportion of Poles and median household income in the United States with a correlation coefficient (R) of -0.598 and weighted average of $88,472. Similarly, the statistical analysis conducted on geographies consisting of 264,333,035 people shows a mild positive correlation between the proportion of Immigrants from Argentina and median household income in the United States with a correlation coefficient (R) of 0.378 and weighted average of $92,417, a difference of 4.5%.
Median Household Income Correlation Summary
| Measurement | Polish | Immigrants from Argentina |
| Minimum | $2,499 | $29,759 |
| Maximum | $112,083 | $250,001 |
| Range | $109,584 | $220,242 |
| Mean | $76,577 | $92,999 |
| Median | $79,444 | $85,824 |
| Interquartile 25% (IQ1) | $62,696 | $66,317 |
| Interquartile 75% (IQ3) | $91,347 | $103,452 |
| Interquartile Range (IQR) | $28,651 | $37,135 |
| Standard Deviation (Sample) | $19,210 | $44,164 |
| Standard Deviation (Population) | $19,121 | $43,823 |
Similar Demographics by Median Household Income
Demographics Similar to Poles by Median Household Income
In terms of median household income, the demographic groups most similar to Poles are Sierra Leonean ($88,463, a difference of 0.010%), Immigrants from Sierra Leone ($88,498, a difference of 0.030%), Swedish ($88,524, a difference of 0.060%), Arab ($88,398, a difference of 0.080%), and Immigrants from Chile ($88,388, a difference of 0.090%).
| Demographics | Rating | Rank | Median Household Income |
| Brazilians | 92.1 /100 | #129 | Exceptional $88,934 |
| British | 92.0 /100 | #130 | Exceptional $88,914 |
| Immigrants | Syria | 91.4 /100 | #131 | Exceptional $88,792 |
| Europeans | 91.2 /100 | #132 | Exceptional $88,751 |
| Immigrants | Ethiopia | 90.9 /100 | #133 | Exceptional $88,687 |
| Swedes | 90.0 /100 | #134 | Exceptional $88,524 |
| Immigrants | Sierra Leone | 89.9 /100 | #135 | Excellent $88,498 |
| Poles | 89.7 /100 | #136 | Excellent $88,472 |
| Sierra Leoneans | 89.6 /100 | #137 | Excellent $88,463 |
| Arabs | 89.2 /100 | #138 | Excellent $88,398 |
| Immigrants | Chile | 89.2 /100 | #139 | Excellent $88,388 |
| Lebanese | 87.2 /100 | #140 | Excellent $88,091 |
| Immigrants | Morocco | 86.0 /100 | #141 | Excellent $87,930 |
| Canadians | 84.7 /100 | #142 | Excellent $87,769 |
| Danes | 83.9 /100 | #143 | Excellent $87,676 |
Demographics Similar to Immigrants from Argentina by Median Household Income
In terms of median household income, the demographic groups most similar to Immigrants from Argentina are Italian ($92,475, a difference of 0.060%), Immigrants from Croatia ($92,225, a difference of 0.21%), Immigrants from Spain ($92,732, a difference of 0.34%), Immigrants from England ($92,098, a difference of 0.35%), and Immigrants from Hungary ($92,094, a difference of 0.35%).
| Demographics | Rating | Rank | Median Household Income |
| Immigrants | Afghanistan | 99.5 /100 | #77 | Exceptional $93,375 |
| Immigrants | Bulgaria | 99.4 /100 | #78 | Exceptional $93,148 |
| Sri Lankans | 99.4 /100 | #79 | Exceptional $93,093 |
| Tongans | 99.4 /100 | #80 | Exceptional $93,076 |
| Immigrants | Eastern Europe | 99.4 /100 | #81 | Exceptional $93,051 |
| Immigrants | Spain | 99.3 /100 | #82 | Exceptional $92,732 |
| Italians | 99.1 /100 | #83 | Exceptional $92,475 |
| Immigrants | Argentina | 99.1 /100 | #84 | Exceptional $92,417 |
| Immigrants | Croatia | 99.0 /100 | #85 | Exceptional $92,225 |
| Immigrants | England | 98.9 /100 | #86 | Exceptional $92,098 |
| Immigrants | Hungary | 98.9 /100 | #87 | Exceptional $92,094 |
| Immigrants | Canada | 98.8 /100 | #88 | Exceptional $92,029 |
| Romanians | 98.8 /100 | #89 | Exceptional $91,994 |
| Assyrians/Chaldeans/Syriacs | 98.8 /100 | #90 | Exceptional $91,991 |
| Immigrants | Vietnam | 98.8 /100 | #91 | Exceptional $91,987 |