Laotian vs Immigrants from Argentina Median Household Income
COMPARE
Laotian
Immigrants from Argentina
Median Household Income
Median Household Income Comparison
Laotians
Immigrants from Argentina
$94,990
MEDIAN HOUSEHOLD INCOME
99.8/ 100
METRIC RATING
61st/ 347
METRIC RANK
$92,417
MEDIAN HOUSEHOLD INCOME
99.1/ 100
METRIC RATING
84th/ 347
METRIC RANK
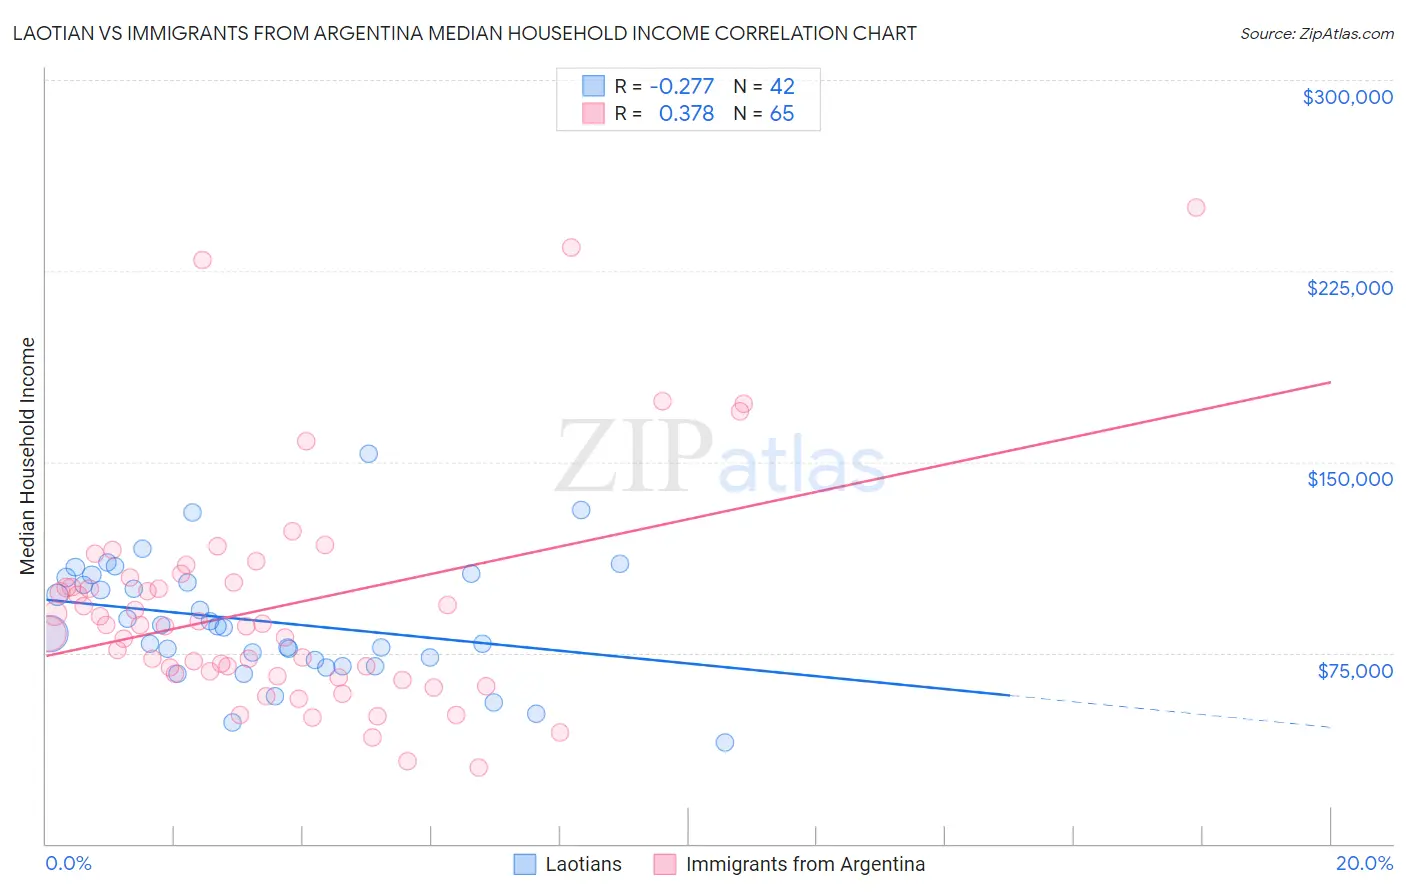
Laotian vs Immigrants from Argentina Median Household Income Correlation Chart
The statistical analysis conducted on geographies consisting of 224,713,642 people shows a weak negative correlation between the proportion of Laotians and median household income in the United States with a correlation coefficient (R) of -0.277 and weighted average of $94,990. Similarly, the statistical analysis conducted on geographies consisting of 264,333,035 people shows a mild positive correlation between the proportion of Immigrants from Argentina and median household income in the United States with a correlation coefficient (R) of 0.378 and weighted average of $92,417, a difference of 2.8%.
Median Household Income Correlation Summary
| Measurement | Laotian | Immigrants from Argentina |
| Minimum | $39,542 | $29,759 |
| Maximum | $153,021 | $250,001 |
| Range | $113,479 | $220,242 |
| Mean | $87,400 | $92,999 |
| Median | $85,171 | $85,824 |
| Interquartile 25% (IQ1) | $72,352 | $66,317 |
| Interquartile 75% (IQ3) | $104,389 | $103,452 |
| Interquartile Range (IQR) | $32,037 | $37,135 |
| Standard Deviation (Sample) | $23,584 | $44,164 |
| Standard Deviation (Population) | $23,302 | $43,823 |
Similar Demographics by Median Household Income
Demographics Similar to Laotians by Median Household Income
In terms of median household income, the demographic groups most similar to Laotians are Korean ($95,018, a difference of 0.030%), Immigrants from Europe ($95,032, a difference of 0.040%), Soviet Union ($95,098, a difference of 0.11%), Immigrants from Norway ($94,846, a difference of 0.15%), and New Zealander ($95,146, a difference of 0.16%).
| Demographics | Rating | Rank | Median Household Income |
| Egyptians | 99.9 /100 | #54 | Exceptional $95,673 |
| Immigrants | Czechoslovakia | 99.9 /100 | #55 | Exceptional $95,319 |
| Immigrants | Austria | 99.9 /100 | #56 | Exceptional $95,277 |
| New Zealanders | 99.8 /100 | #57 | Exceptional $95,146 |
| Soviet Union | 99.8 /100 | #58 | Exceptional $95,098 |
| Immigrants | Europe | 99.8 /100 | #59 | Exceptional $95,032 |
| Koreans | 99.8 /100 | #60 | Exceptional $95,018 |
| Laotians | 99.8 /100 | #61 | Exceptional $94,990 |
| Immigrants | Norway | 99.8 /100 | #62 | Exceptional $94,846 |
| Greeks | 99.8 /100 | #63 | Exceptional $94,735 |
| Immigrants | Netherlands | 99.7 /100 | #64 | Exceptional $94,411 |
| Immigrants | Belarus | 99.7 /100 | #65 | Exceptional $94,399 |
| Immigrants | Romania | 99.7 /100 | #66 | Exceptional $94,222 |
| Immigrants | Scotland | 99.7 /100 | #67 | Exceptional $94,091 |
| Mongolians | 99.7 /100 | #68 | Exceptional $93,971 |
Demographics Similar to Immigrants from Argentina by Median Household Income
In terms of median household income, the demographic groups most similar to Immigrants from Argentina are Italian ($92,475, a difference of 0.060%), Immigrants from Croatia ($92,225, a difference of 0.21%), Immigrants from Spain ($92,732, a difference of 0.34%), Immigrants from England ($92,098, a difference of 0.35%), and Immigrants from Hungary ($92,094, a difference of 0.35%).
| Demographics | Rating | Rank | Median Household Income |
| Immigrants | Afghanistan | 99.5 /100 | #77 | Exceptional $93,375 |
| Immigrants | Bulgaria | 99.4 /100 | #78 | Exceptional $93,148 |
| Sri Lankans | 99.4 /100 | #79 | Exceptional $93,093 |
| Tongans | 99.4 /100 | #80 | Exceptional $93,076 |
| Immigrants | Eastern Europe | 99.4 /100 | #81 | Exceptional $93,051 |
| Immigrants | Spain | 99.3 /100 | #82 | Exceptional $92,732 |
| Italians | 99.1 /100 | #83 | Exceptional $92,475 |
| Immigrants | Argentina | 99.1 /100 | #84 | Exceptional $92,417 |
| Immigrants | Croatia | 99.0 /100 | #85 | Exceptional $92,225 |
| Immigrants | England | 98.9 /100 | #86 | Exceptional $92,098 |
| Immigrants | Hungary | 98.9 /100 | #87 | Exceptional $92,094 |
| Immigrants | Canada | 98.8 /100 | #88 | Exceptional $92,029 |
| Romanians | 98.8 /100 | #89 | Exceptional $91,994 |
| Assyrians/Chaldeans/Syriacs | 98.8 /100 | #90 | Exceptional $91,991 |
| Immigrants | Vietnam | 98.8 /100 | #91 | Exceptional $91,987 |