Polish vs Cheyenne Median Household Income
COMPARE
Polish
Cheyenne
Median Household Income
Median Household Income Comparison
Poles
Cheyenne
$88,472
MEDIAN HOUSEHOLD INCOME
89.7/ 100
METRIC RATING
136th/ 347
METRIC RANK
$66,974
MEDIAN HOUSEHOLD INCOME
0.0/ 100
METRIC RATING
335th/ 347
METRIC RANK
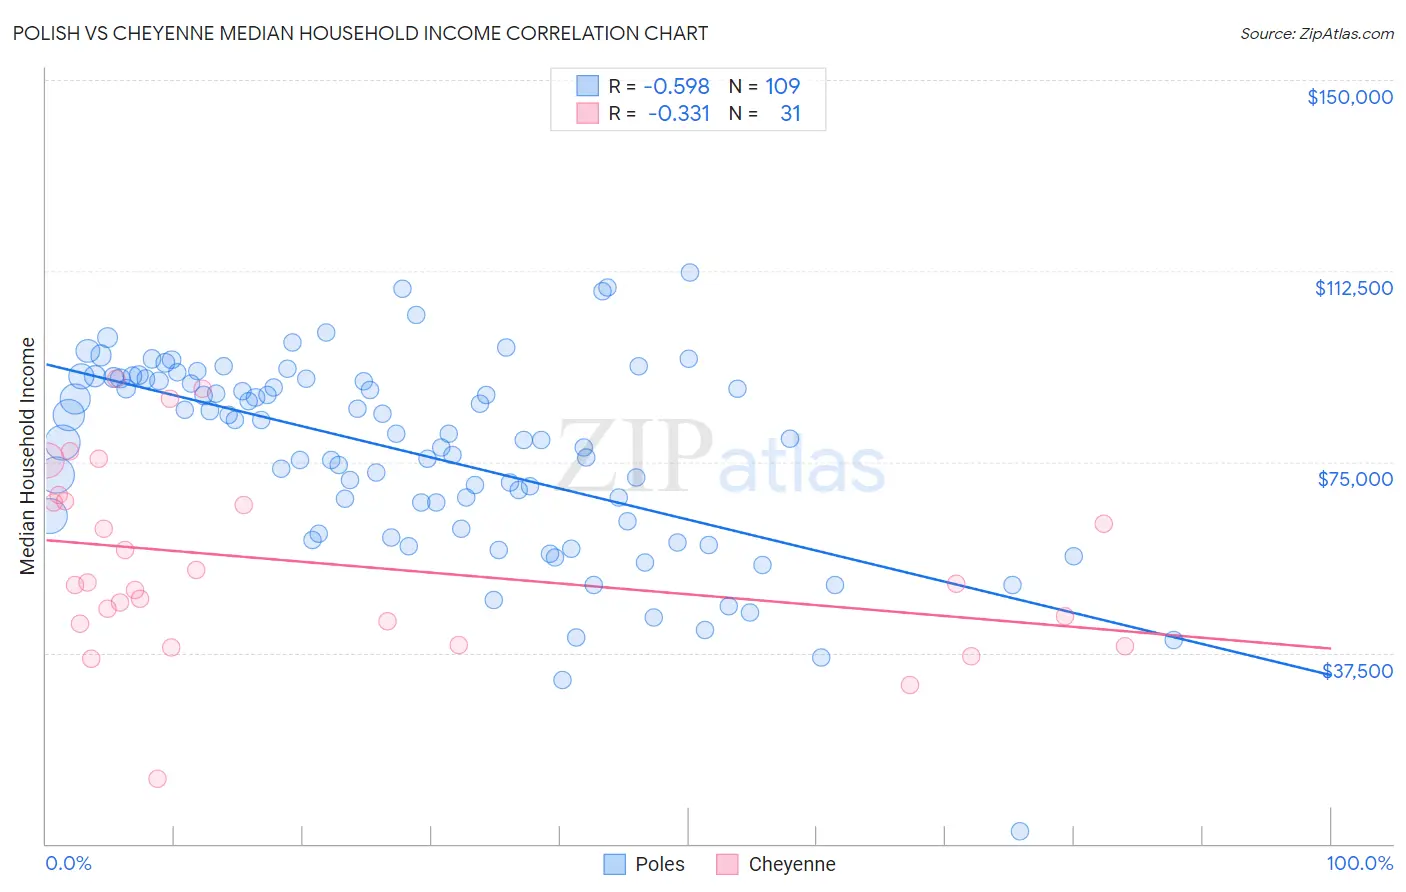
Polish vs Cheyenne Median Household Income Correlation Chart
The statistical analysis conducted on geographies consisting of 559,571,407 people shows a substantial negative correlation between the proportion of Poles and median household income in the United States with a correlation coefficient (R) of -0.598 and weighted average of $88,472. Similarly, the statistical analysis conducted on geographies consisting of 80,700,473 people shows a mild negative correlation between the proportion of Cheyenne and median household income in the United States with a correlation coefficient (R) of -0.331 and weighted average of $66,974, a difference of 32.1%.
Median Household Income Correlation Summary
| Measurement | Polish | Cheyenne |
| Minimum | $2,499 | $12,708 |
| Maximum | $112,083 | $91,250 |
| Range | $109,584 | $78,542 |
| Mean | $76,577 | $55,202 |
| Median | $79,444 | $51,125 |
| Interquartile 25% (IQ1) | $62,696 | $43,228 |
| Interquartile 75% (IQ3) | $91,347 | $67,262 |
| Interquartile Range (IQR) | $28,651 | $24,034 |
| Standard Deviation (Sample) | $19,210 | $18,300 |
| Standard Deviation (Population) | $19,121 | $18,003 |
Similar Demographics by Median Household Income
Demographics Similar to Poles by Median Household Income
In terms of median household income, the demographic groups most similar to Poles are Sierra Leonean ($88,463, a difference of 0.010%), Immigrants from Sierra Leone ($88,498, a difference of 0.030%), Swedish ($88,524, a difference of 0.060%), Arab ($88,398, a difference of 0.080%), and Immigrants from Chile ($88,388, a difference of 0.090%).
| Demographics | Rating | Rank | Median Household Income |
| Brazilians | 92.1 /100 | #129 | Exceptional $88,934 |
| British | 92.0 /100 | #130 | Exceptional $88,914 |
| Immigrants | Syria | 91.4 /100 | #131 | Exceptional $88,792 |
| Europeans | 91.2 /100 | #132 | Exceptional $88,751 |
| Immigrants | Ethiopia | 90.9 /100 | #133 | Exceptional $88,687 |
| Swedes | 90.0 /100 | #134 | Exceptional $88,524 |
| Immigrants | Sierra Leone | 89.9 /100 | #135 | Excellent $88,498 |
| Poles | 89.7 /100 | #136 | Excellent $88,472 |
| Sierra Leoneans | 89.6 /100 | #137 | Excellent $88,463 |
| Arabs | 89.2 /100 | #138 | Excellent $88,398 |
| Immigrants | Chile | 89.2 /100 | #139 | Excellent $88,388 |
| Lebanese | 87.2 /100 | #140 | Excellent $88,091 |
| Immigrants | Morocco | 86.0 /100 | #141 | Excellent $87,930 |
| Canadians | 84.7 /100 | #142 | Excellent $87,769 |
| Danes | 83.9 /100 | #143 | Excellent $87,676 |
Demographics Similar to Cheyenne by Median Household Income
In terms of median household income, the demographic groups most similar to Cheyenne are Immigrants from Congo ($66,768, a difference of 0.31%), Black/African American ($67,573, a difference of 0.89%), Creek ($67,715, a difference of 1.1%), Sioux ($67,792, a difference of 1.2%), and Native/Alaskan ($67,879, a difference of 1.3%).
| Demographics | Rating | Rank | Median Household Income |
| Menominee | 0.0 /100 | #328 | Tragic $68,423 |
| Dutch West Indians | 0.0 /100 | #329 | Tragic $68,412 |
| Arapaho | 0.0 /100 | #330 | Tragic $67,965 |
| Natives/Alaskans | 0.0 /100 | #331 | Tragic $67,879 |
| Sioux | 0.0 /100 | #332 | Tragic $67,792 |
| Creek | 0.0 /100 | #333 | Tragic $67,715 |
| Blacks/African Americans | 0.0 /100 | #334 | Tragic $67,573 |
| Cheyenne | 0.0 /100 | #335 | Tragic $66,974 |
| Immigrants | Congo | 0.0 /100 | #336 | Tragic $66,768 |
| Kiowa | 0.0 /100 | #337 | Tragic $65,914 |
| Immigrants | Yemen | 0.0 /100 | #338 | Tragic $65,194 |
| Hopi | 0.0 /100 | #339 | Tragic $65,043 |
| Pueblo | 0.0 /100 | #340 | Tragic $64,692 |
| Crow | 0.0 /100 | #341 | Tragic $63,681 |
| Pima | 0.0 /100 | #342 | Tragic $63,262 |