Choctaw vs Immigrants from Argentina Median Household Income
COMPARE
Choctaw
Immigrants from Argentina
Median Household Income
Median Household Income Comparison
Choctaw
Immigrants from Argentina
$69,947
MEDIAN HOUSEHOLD INCOME
0.0/ 100
METRIC RATING
322nd/ 347
METRIC RANK
$92,417
MEDIAN HOUSEHOLD INCOME
99.1/ 100
METRIC RATING
84th/ 347
METRIC RANK
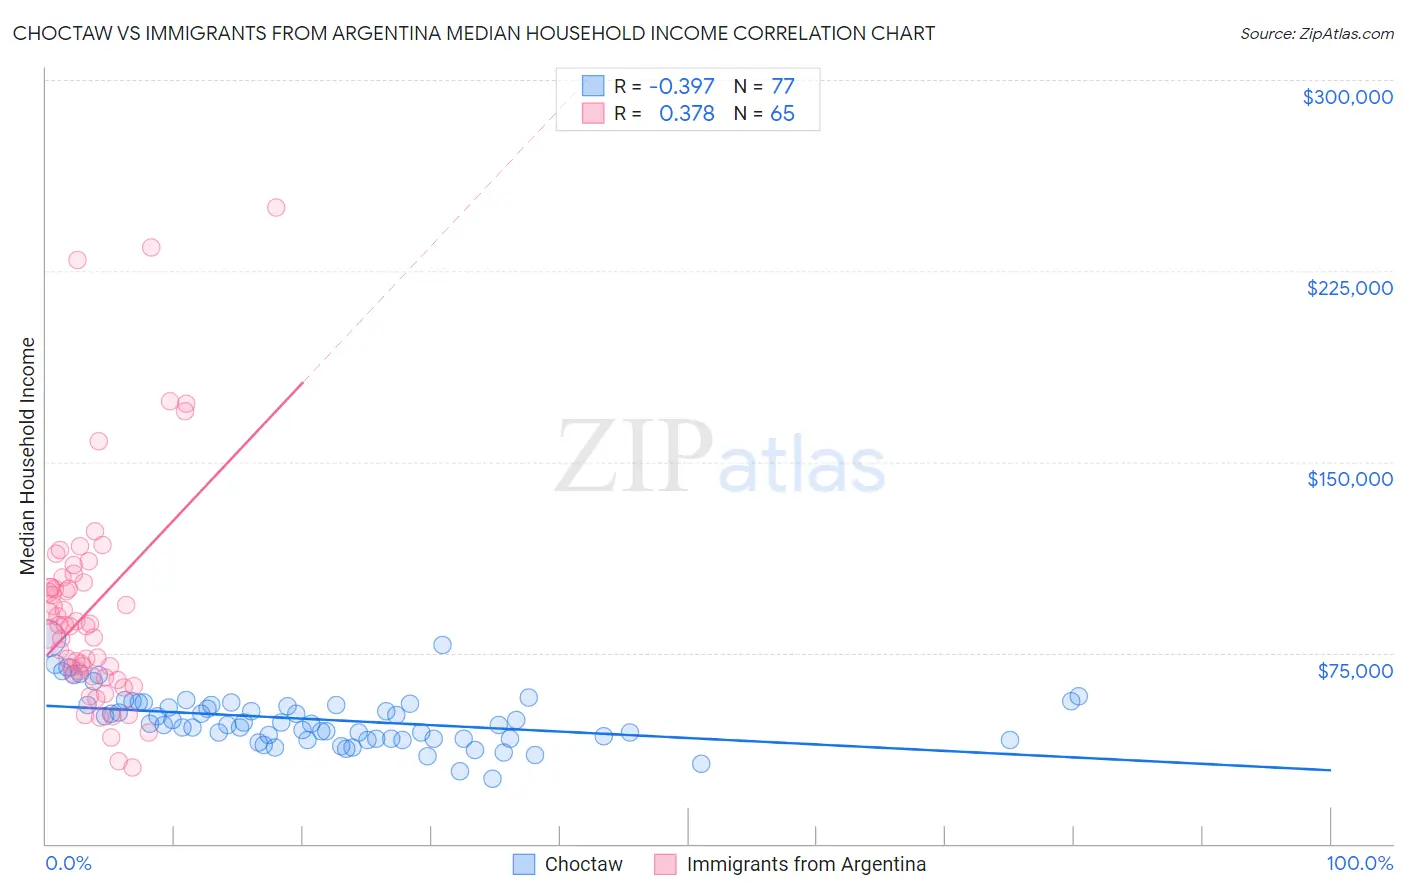
Choctaw vs Immigrants from Argentina Median Household Income Correlation Chart
The statistical analysis conducted on geographies consisting of 269,579,280 people shows a mild negative correlation between the proportion of Choctaw and median household income in the United States with a correlation coefficient (R) of -0.397 and weighted average of $69,947. Similarly, the statistical analysis conducted on geographies consisting of 264,333,035 people shows a mild positive correlation between the proportion of Immigrants from Argentina and median household income in the United States with a correlation coefficient (R) of 0.378 and weighted average of $92,417, a difference of 32.1%.
Median Household Income Correlation Summary
| Measurement | Choctaw | Immigrants from Argentina |
| Minimum | $25,625 | $29,759 |
| Maximum | $80,457 | $250,001 |
| Range | $54,832 | $220,242 |
| Mean | $48,786 | $92,999 |
| Median | $47,101 | $85,824 |
| Interquartile 25% (IQ1) | $41,215 | $66,317 |
| Interquartile 75% (IQ3) | $54,919 | $103,452 |
| Interquartile Range (IQR) | $13,705 | $37,135 |
| Standard Deviation (Sample) | $10,591 | $44,164 |
| Standard Deviation (Population) | $10,522 | $43,823 |
Similar Demographics by Median Household Income
Demographics Similar to Choctaw by Median Household Income
In terms of median household income, the demographic groups most similar to Choctaw are Chickasaw ($70,005, a difference of 0.080%), Colville ($70,094, a difference of 0.21%), Bahamian ($69,726, a difference of 0.32%), Yup'ik ($69,695, a difference of 0.36%), and Immigrants from Dominican Republic ($70,208, a difference of 0.37%).
| Demographics | Rating | Rank | Median Household Income |
| Ottawa | 0.0 /100 | #315 | Tragic $70,984 |
| Apache | 0.0 /100 | #316 | Tragic $70,927 |
| Cajuns | 0.0 /100 | #317 | Tragic $70,605 |
| Chippewa | 0.0 /100 | #318 | Tragic $70,539 |
| Immigrants | Dominican Republic | 0.0 /100 | #319 | Tragic $70,208 |
| Colville | 0.0 /100 | #320 | Tragic $70,094 |
| Chickasaw | 0.0 /100 | #321 | Tragic $70,005 |
| Choctaw | 0.0 /100 | #322 | Tragic $69,947 |
| Bahamians | 0.0 /100 | #323 | Tragic $69,726 |
| Yup'ik | 0.0 /100 | #324 | Tragic $69,695 |
| Seminole | 0.0 /100 | #325 | Tragic $69,420 |
| Yuman | 0.0 /100 | #326 | Tragic $68,743 |
| Immigrants | Cuba | 0.0 /100 | #327 | Tragic $68,461 |
| Menominee | 0.0 /100 | #328 | Tragic $68,423 |
| Dutch West Indians | 0.0 /100 | #329 | Tragic $68,412 |
Demographics Similar to Immigrants from Argentina by Median Household Income
In terms of median household income, the demographic groups most similar to Immigrants from Argentina are Italian ($92,475, a difference of 0.060%), Immigrants from Croatia ($92,225, a difference of 0.21%), Immigrants from Spain ($92,732, a difference of 0.34%), Immigrants from England ($92,098, a difference of 0.35%), and Immigrants from Hungary ($92,094, a difference of 0.35%).
| Demographics | Rating | Rank | Median Household Income |
| Immigrants | Afghanistan | 99.5 /100 | #77 | Exceptional $93,375 |
| Immigrants | Bulgaria | 99.4 /100 | #78 | Exceptional $93,148 |
| Sri Lankans | 99.4 /100 | #79 | Exceptional $93,093 |
| Tongans | 99.4 /100 | #80 | Exceptional $93,076 |
| Immigrants | Eastern Europe | 99.4 /100 | #81 | Exceptional $93,051 |
| Immigrants | Spain | 99.3 /100 | #82 | Exceptional $92,732 |
| Italians | 99.1 /100 | #83 | Exceptional $92,475 |
| Immigrants | Argentina | 99.1 /100 | #84 | Exceptional $92,417 |
| Immigrants | Croatia | 99.0 /100 | #85 | Exceptional $92,225 |
| Immigrants | England | 98.9 /100 | #86 | Exceptional $92,098 |
| Immigrants | Hungary | 98.9 /100 | #87 | Exceptional $92,094 |
| Immigrants | Canada | 98.8 /100 | #88 | Exceptional $92,029 |
| Romanians | 98.8 /100 | #89 | Exceptional $91,994 |
| Assyrians/Chaldeans/Syriacs | 98.8 /100 | #90 | Exceptional $91,991 |
| Immigrants | Vietnam | 98.8 /100 | #91 | Exceptional $91,987 |