Sierra Leonean vs British Householder Income Under 25 years
COMPARE
Sierra Leonean
British
Householder Income Under 25 years
Householder Income Under 25 years Comparison
Sierra Leoneans
British
$57,272
HOUSEHOLDER INCOME UNDER 25 YEARS
100.0/ 100
METRIC RATING
17th/ 347
METRIC RANK
$51,477
HOUSEHOLDER INCOME UNDER 25 YEARS
14.9/ 100
METRIC RATING
201st/ 347
METRIC RANK
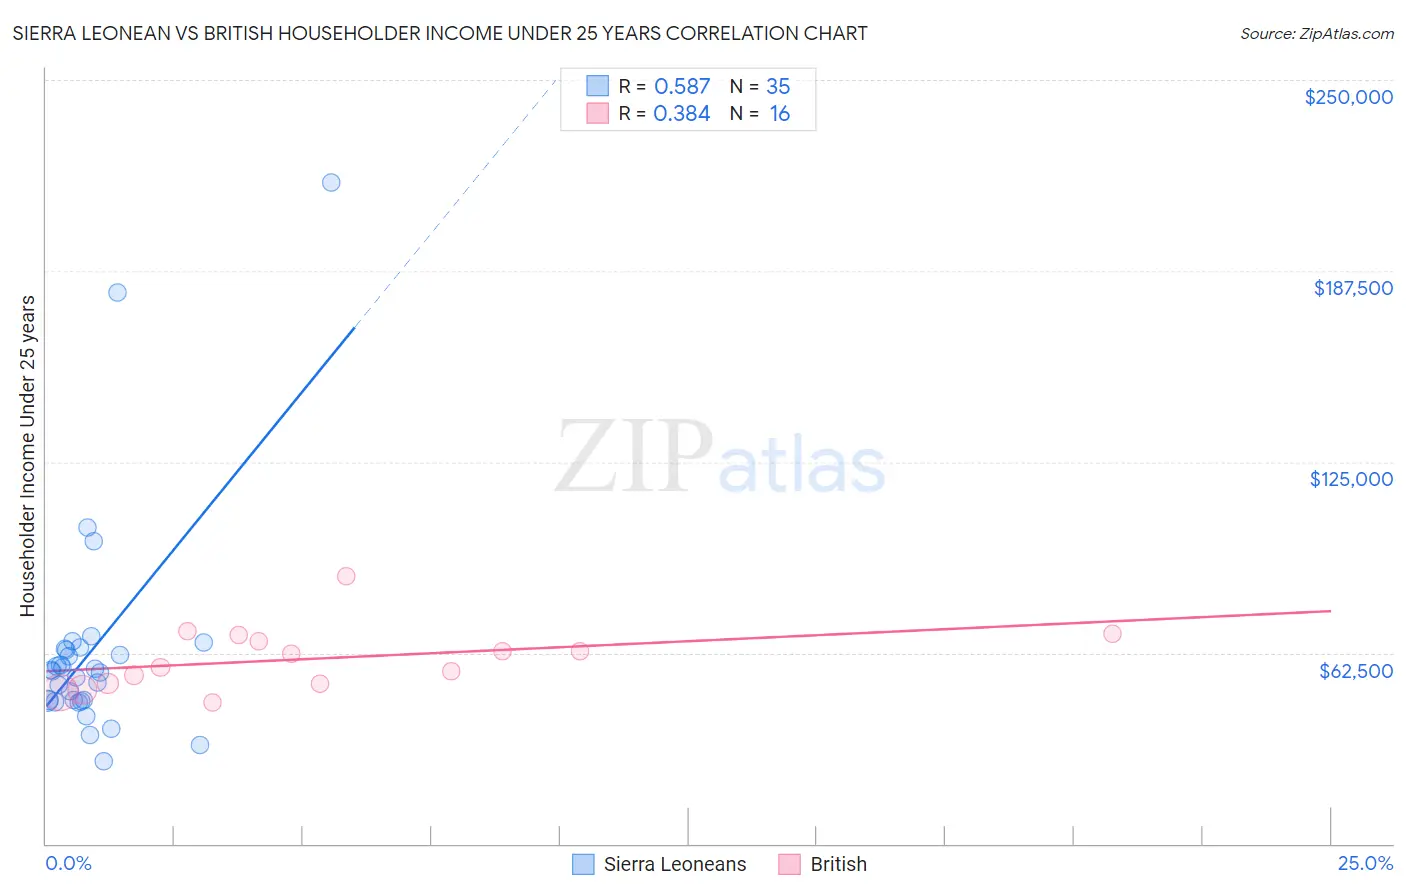
Sierra Leonean vs British Householder Income Under 25 years Correlation Chart
The statistical analysis conducted on geographies consisting of 78,503,409 people shows a substantial positive correlation between the proportion of Sierra Leoneans and household income with householder under the age of 25 in the United States with a correlation coefficient (R) of 0.587 and weighted average of $57,272. Similarly, the statistical analysis conducted on geographies consisting of 421,331,557 people shows a mild positive correlation between the proportion of British and household income with householder under the age of 25 in the United States with a correlation coefficient (R) of 0.384 and weighted average of $51,477, a difference of 11.3%.
Householder Income Under 25 years Correlation Summary
| Measurement | Sierra Leonean | British |
| Minimum | $26,847 | $46,064 |
| Maximum | $216,509 | $87,721 |
| Range | $189,662 | $41,657 |
| Mean | $63,601 | $60,580 |
| Median | $56,595 | $59,896 |
| Interquartile 25% (IQ1) | $46,837 | $52,513 |
| Interquartile 75% (IQ3) | $63,925 | $67,314 |
| Interquartile Range (IQR) | $17,087 | $14,801 |
| Standard Deviation (Sample) | $37,157 | $10,393 |
| Standard Deviation (Population) | $36,623 | $10,063 |
Similar Demographics by Householder Income Under 25 years
Demographics Similar to Sierra Leoneans by Householder Income Under 25 years
In terms of householder income under 25 years, the demographic groups most similar to Sierra Leoneans are Immigrants from Eastern Asia ($57,123, a difference of 0.26%), Bhutanese ($57,078, a difference of 0.34%), Immigrants from Ireland ($57,075, a difference of 0.35%), Immigrants from Fiji ($57,074, a difference of 0.35%), and Immigrants from Afghanistan ($57,478, a difference of 0.36%).
| Demographics | Rating | Rank | Householder Income Under 25 years |
| Afghans | 100.0 /100 | #10 | Exceptional $58,019 |
| Immigrants | China | 100.0 /100 | #11 | Exceptional $57,931 |
| Immigrants | Philippines | 100.0 /100 | #12 | Exceptional $57,930 |
| Immigrants | South Central Asia | 100.0 /100 | #13 | Exceptional $57,818 |
| Filipinos | 100.0 /100 | #14 | Exceptional $57,740 |
| Koreans | 100.0 /100 | #15 | Exceptional $57,730 |
| Immigrants | Afghanistan | 100.0 /100 | #16 | Exceptional $57,478 |
| Sierra Leoneans | 100.0 /100 | #17 | Exceptional $57,272 |
| Immigrants | Eastern Asia | 100.0 /100 | #18 | Exceptional $57,123 |
| Bhutanese | 100.0 /100 | #19 | Exceptional $57,078 |
| Immigrants | Ireland | 100.0 /100 | #20 | Exceptional $57,075 |
| Immigrants | Fiji | 100.0 /100 | #21 | Exceptional $57,074 |
| Asians | 100.0 /100 | #22 | Exceptional $57,003 |
| Tongans | 100.0 /100 | #23 | Exceptional $56,972 |
| Immigrants | Singapore | 100.0 /100 | #24 | Exceptional $56,835 |
Demographics Similar to British by Householder Income Under 25 years
In terms of householder income under 25 years, the demographic groups most similar to British are Immigrants from West Indies ($51,479, a difference of 0.0%), Immigrants from Syria ($51,494, a difference of 0.030%), Swiss ($51,493, a difference of 0.030%), Pima ($51,503, a difference of 0.050%), and Immigrants from Guatemala ($51,447, a difference of 0.060%).
| Demographics | Rating | Rank | Householder Income Under 25 years |
| Guatemalans | 16.4 /100 | #194 | Poor $51,525 |
| Estonians | 16.4 /100 | #195 | Poor $51,523 |
| Palestinians | 16.1 /100 | #196 | Poor $51,515 |
| Pima | 15.7 /100 | #197 | Poor $51,503 |
| Immigrants | Syria | 15.4 /100 | #198 | Poor $51,494 |
| Swiss | 15.4 /100 | #199 | Poor $51,493 |
| Immigrants | West Indies | 14.9 /100 | #200 | Poor $51,479 |
| British | 14.9 /100 | #201 | Poor $51,477 |
| Immigrants | Guatemala | 14.0 /100 | #202 | Poor $51,447 |
| Immigrants | Cameroon | 13.6 /100 | #203 | Poor $51,433 |
| Czechs | 13.2 /100 | #204 | Poor $51,421 |
| Cape Verdeans | 12.3 /100 | #205 | Poor $51,387 |
| Immigrants | Latin America | 12.3 /100 | #206 | Poor $51,387 |
| South Africans | 12.2 /100 | #207 | Poor $51,383 |
| Immigrants | Jordan | 11.9 /100 | #208 | Poor $51,370 |