Arab vs British Householder Income Under 25 years
COMPARE
Arab
British
Householder Income Under 25 years
Householder Income Under 25 years Comparison
Arabs
British
$51,219
HOUSEHOLDER INCOME UNDER 25 YEARS
8.5/ 100
METRIC RATING
219th/ 347
METRIC RANK
$51,477
HOUSEHOLDER INCOME UNDER 25 YEARS
14.9/ 100
METRIC RATING
201st/ 347
METRIC RANK
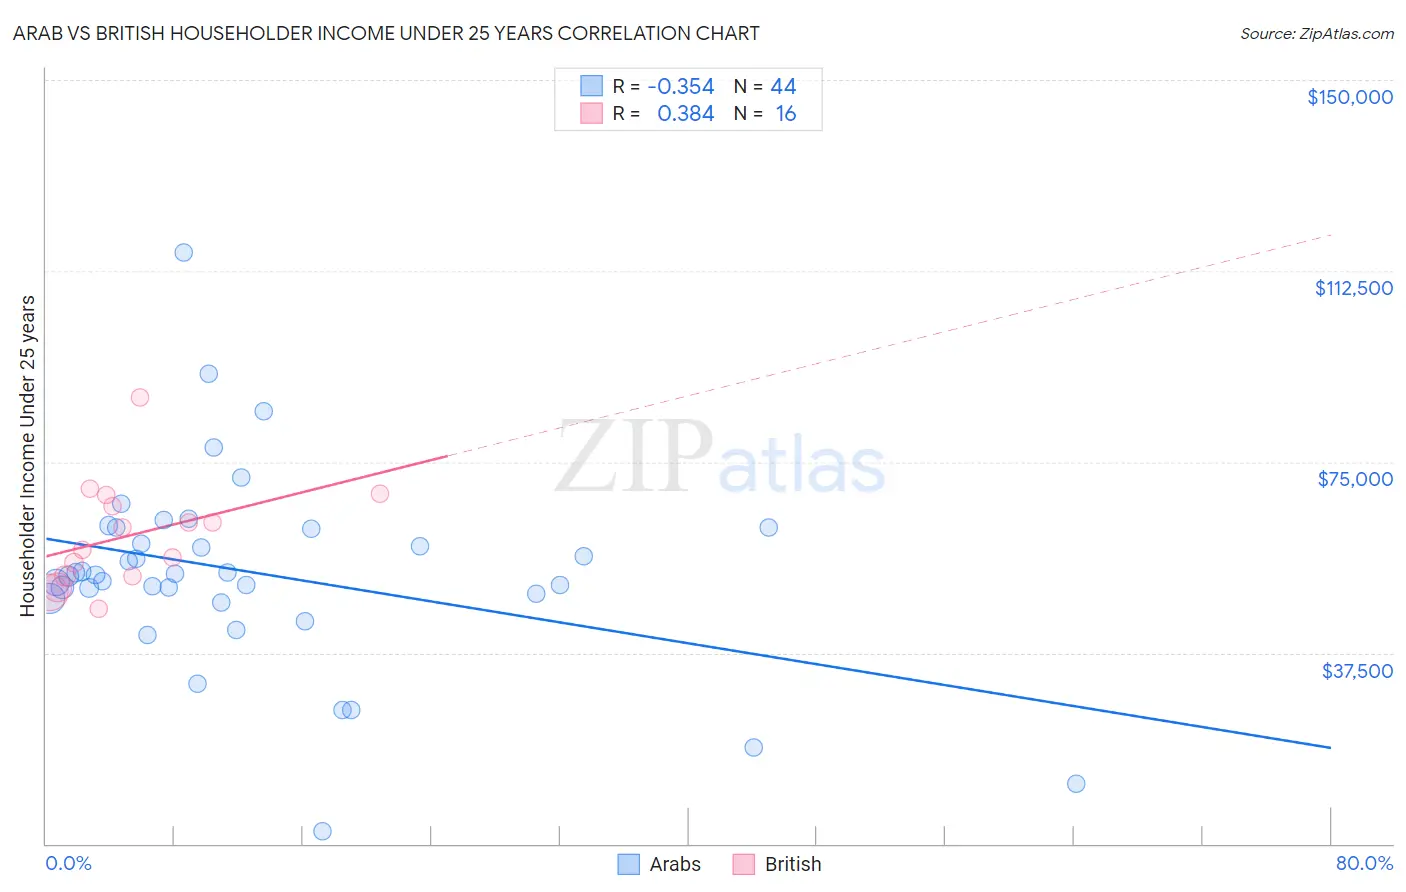
Arab vs British Householder Income Under 25 years Correlation Chart
The statistical analysis conducted on geographies consisting of 397,690,882 people shows a mild negative correlation between the proportion of Arabs and household income with householder under the age of 25 in the United States with a correlation coefficient (R) of -0.354 and weighted average of $51,219. Similarly, the statistical analysis conducted on geographies consisting of 421,331,557 people shows a mild positive correlation between the proportion of British and household income with householder under the age of 25 in the United States with a correlation coefficient (R) of 0.384 and weighted average of $51,477, a difference of 0.50%.
Householder Income Under 25 years Correlation Summary
| Measurement | Arab | British |
| Minimum | $2,499 | $46,064 |
| Maximum | $116,189 | $87,721 |
| Range | $113,690 | $41,657 |
| Mean | $53,228 | $60,580 |
| Median | $52,860 | $59,896 |
| Interquartile 25% (IQ1) | $48,642 | $52,513 |
| Interquartile 75% (IQ3) | $61,942 | $67,314 |
| Interquartile Range (IQR) | $13,300 | $14,801 |
| Standard Deviation (Sample) | $19,395 | $10,393 |
| Standard Deviation (Population) | $19,173 | $10,063 |
Demographics Similar to Arabs and British by Householder Income Under 25 years
In terms of householder income under 25 years, the demographic groups most similar to Arabs are Czechoslovakian ($51,224, a difference of 0.010%), Immigrants from Belize ($51,223, a difference of 0.010%), French ($51,230, a difference of 0.020%), Icelander ($51,247, a difference of 0.050%), and Immigrants from Germany ($51,190, a difference of 0.060%). Similarly, the demographic groups most similar to British are Immigrants from West Indies ($51,479, a difference of 0.0%), Immigrants from Guatemala ($51,447, a difference of 0.060%), Immigrants from Cameroon ($51,433, a difference of 0.090%), Czech ($51,421, a difference of 0.11%), and Cape Verdean ($51,387, a difference of 0.18%).
| Demographics | Rating | Rank | Householder Income Under 25 years |
| Immigrants | West Indies | 14.9 /100 | #200 | Poor $51,479 |
| British | 14.9 /100 | #201 | Poor $51,477 |
| Immigrants | Guatemala | 14.0 /100 | #202 | Poor $51,447 |
| Immigrants | Cameroon | 13.6 /100 | #203 | Poor $51,433 |
| Czechs | 13.2 /100 | #204 | Poor $51,421 |
| Cape Verdeans | 12.3 /100 | #205 | Poor $51,387 |
| Immigrants | Latin America | 12.3 /100 | #206 | Poor $51,387 |
| South Africans | 12.2 /100 | #207 | Poor $51,383 |
| Immigrants | Jordan | 11.9 /100 | #208 | Poor $51,370 |
| Syrians | 11.4 /100 | #209 | Poor $51,353 |
| Immigrants | Ghana | 10.9 /100 | #210 | Poor $51,333 |
| Irish | 10.6 /100 | #211 | Poor $51,317 |
| Immigrants | Panama | 9.7 /100 | #212 | Tragic $51,278 |
| Dutch | 9.4 /100 | #213 | Tragic $51,265 |
| Zimbabweans | 9.3 /100 | #214 | Tragic $51,259 |
| Icelanders | 9.1 /100 | #215 | Tragic $51,247 |
| French | 8.7 /100 | #216 | Tragic $51,230 |
| Czechoslovakians | 8.6 /100 | #217 | Tragic $51,224 |
| Immigrants | Belize | 8.6 /100 | #218 | Tragic $51,223 |
| Arabs | 8.5 /100 | #219 | Tragic $51,219 |
| Immigrants | Germany | 8.0 /100 | #220 | Tragic $51,190 |