Paraguayan vs Immigrants from Trinidad and Tobago Per Capita Income
COMPARE
Paraguayan
Immigrants from Trinidad and Tobago
Per Capita Income
Per Capita Income Comparison
Paraguayans
Immigrants from Trinidad and Tobago
$50,385
PER CAPITA INCOME
99.9/ 100
METRIC RATING
53rd/ 347
METRIC RANK
$41,476
PER CAPITA INCOME
7.9/ 100
METRIC RATING
221st/ 347
METRIC RANK
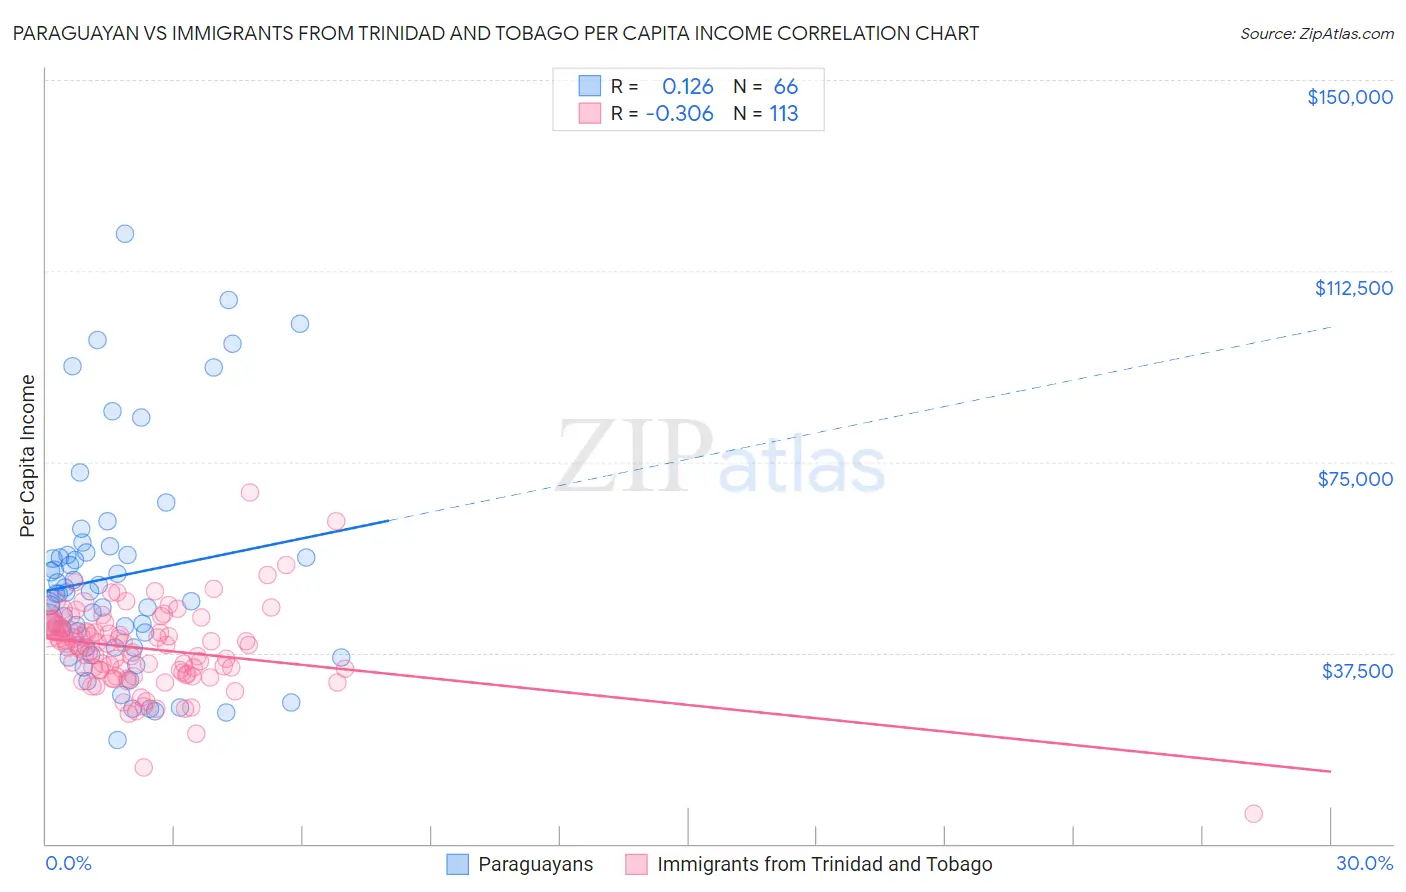
Paraguayan vs Immigrants from Trinidad and Tobago Per Capita Income Correlation Chart
The statistical analysis conducted on geographies consisting of 95,089,637 people shows a poor positive correlation between the proportion of Paraguayans and per capita income in the United States with a correlation coefficient (R) of 0.126 and weighted average of $50,385. Similarly, the statistical analysis conducted on geographies consisting of 223,544,237 people shows a mild negative correlation between the proportion of Immigrants from Trinidad and Tobago and per capita income in the United States with a correlation coefficient (R) of -0.306 and weighted average of $41,476, a difference of 21.5%.
Per Capita Income Correlation Summary
| Measurement | Paraguayan | Immigrants from Trinidad and Tobago |
| Minimum | $20,486 | $5,914 |
| Maximum | $119,781 | $68,888 |
| Range | $99,295 | $62,974 |
| Mean | $52,548 | $38,326 |
| Median | $49,067 | $38,965 |
| Interquartile 25% (IQ1) | $38,496 | $33,457 |
| Interquartile 75% (IQ3) | $56,770 | $42,576 |
| Interquartile Range (IQR) | $18,274 | $9,119 |
| Standard Deviation (Sample) | $21,489 | $8,310 |
| Standard Deviation (Population) | $21,325 | $8,273 |
Similar Demographics by Per Capita Income
Demographics Similar to Paraguayans by Per Capita Income
In terms of per capita income, the demographic groups most similar to Paraguayans are Immigrants from Croatia ($50,417, a difference of 0.060%), Immigrants from Netherlands ($50,458, a difference of 0.14%), Immigrants from Belarus ($50,303, a difference of 0.16%), Immigrants from Sri Lanka ($50,555, a difference of 0.34%), and New Zealander ($50,575, a difference of 0.38%).
| Demographics | Rating | Rank | Per Capita Income |
| Immigrants | Latvia | 100.0 /100 | #46 | Exceptional $50,914 |
| Bulgarians | 100.0 /100 | #47 | Exceptional $50,906 |
| Immigrants | Serbia | 100.0 /100 | #48 | Exceptional $50,810 |
| New Zealanders | 100.0 /100 | #49 | Exceptional $50,575 |
| Immigrants | Sri Lanka | 100.0 /100 | #50 | Exceptional $50,555 |
| Immigrants | Netherlands | 100.0 /100 | #51 | Exceptional $50,458 |
| Immigrants | Croatia | 99.9 /100 | #52 | Exceptional $50,417 |
| Paraguayans | 99.9 /100 | #53 | Exceptional $50,385 |
| Immigrants | Belarus | 99.9 /100 | #54 | Exceptional $50,303 |
| Immigrants | Western Europe | 99.9 /100 | #55 | Exceptional $50,065 |
| Asians | 99.9 /100 | #56 | Exceptional $50,057 |
| South Africans | 99.9 /100 | #57 | Exceptional $50,044 |
| Immigrants | Malaysia | 99.9 /100 | #58 | Exceptional $49,983 |
| Bhutanese | 99.9 /100 | #59 | Exceptional $49,894 |
| Immigrants | Scotland | 99.9 /100 | #60 | Exceptional $49,893 |
Demographics Similar to Immigrants from Trinidad and Tobago by Per Capita Income
In terms of per capita income, the demographic groups most similar to Immigrants from Trinidad and Tobago are Immigrants from Barbados ($41,478, a difference of 0.0%), Puget Sound Salish ($41,495, a difference of 0.040%), Immigrants from Iraq ($41,365, a difference of 0.27%), Immigrants from Cameroon ($41,334, a difference of 0.34%), and Trinidadian and Tobagonian ($41,655, a difference of 0.43%).
| Demographics | Rating | Rank | Per Capita Income |
| Immigrants | Bangladesh | 10.1 /100 | #214 | Poor $41,709 |
| Sudanese | 9.9 /100 | #215 | Tragic $41,695 |
| Tongans | 9.9 /100 | #216 | Tragic $41,693 |
| Guamanians/Chamorros | 9.7 /100 | #217 | Tragic $41,678 |
| Trinidadians and Tobagonians | 9.5 /100 | #218 | Tragic $41,655 |
| Puget Sound Salish | 8.1 /100 | #219 | Tragic $41,495 |
| Immigrants | Barbados | 7.9 /100 | #220 | Tragic $41,478 |
| Immigrants | Trinidad and Tobago | 7.9 /100 | #221 | Tragic $41,476 |
| Immigrants | Iraq | 7.1 /100 | #222 | Tragic $41,365 |
| Immigrants | Cameroon | 6.8 /100 | #223 | Tragic $41,334 |
| Immigrants | St. Vincent and the Grenadines | 6.4 /100 | #224 | Tragic $41,270 |
| West Indians | 6.0 /100 | #225 | Tragic $41,217 |
| Immigrants | Ecuador | 5.9 /100 | #226 | Tragic $41,195 |
| Immigrants | Ghana | 5.5 /100 | #227 | Tragic $41,131 |
| Immigrants | Grenada | 5.5 /100 | #228 | Tragic $41,123 |