Panamanian vs Immigrants from Pakistan Divorced or Separated
COMPARE
Panamanian
Immigrants from Pakistan
Divorced or Separated
Divorced or Separated Comparison
Panamanians
Immigrants from Pakistan
12.7%
DIVORCED OR SEPARATED
0.3/ 100
METRIC RATING
271st/ 347
METRIC RANK
10.8%
DIVORCED OR SEPARATED
100.0/ 100
METRIC RATING
23rd/ 347
METRIC RANK
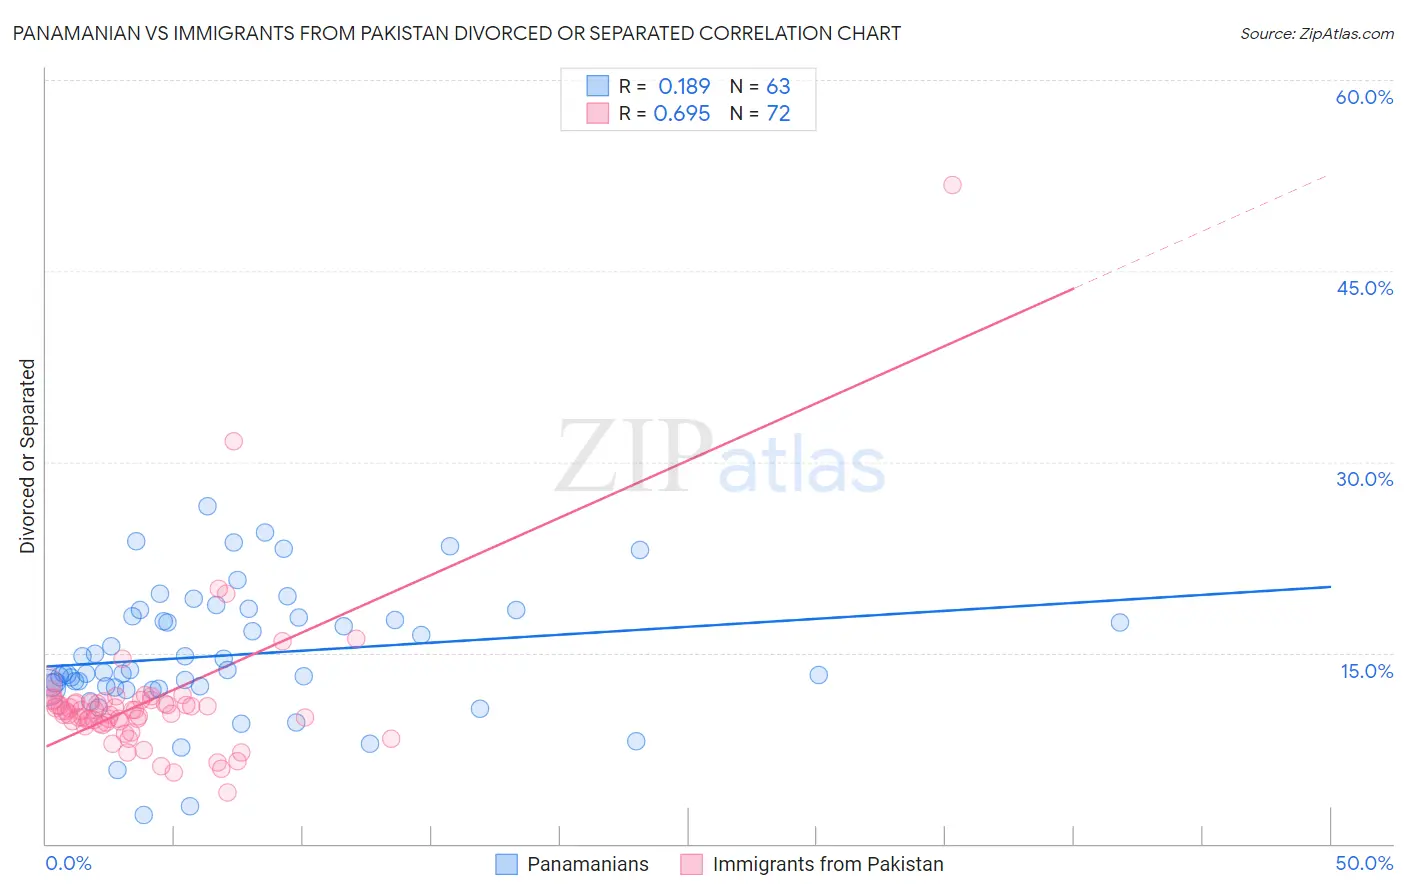
Panamanian vs Immigrants from Pakistan Divorced or Separated Correlation Chart
The statistical analysis conducted on geographies consisting of 281,170,767 people shows a poor positive correlation between the proportion of Panamanians and percentage of population currently divorced or separated in the United States with a correlation coefficient (R) of 0.189 and weighted average of 12.7%. Similarly, the statistical analysis conducted on geographies consisting of 283,830,422 people shows a significant positive correlation between the proportion of Immigrants from Pakistan and percentage of population currently divorced or separated in the United States with a correlation coefficient (R) of 0.695 and weighted average of 10.8%, a difference of 17.3%.
Divorced or Separated Correlation Summary
| Measurement | Panamanian | Immigrants from Pakistan |
| Minimum | 2.3% | 4.0% |
| Maximum | 26.5% | 51.8% |
| Range | 24.2% | 47.8% |
| Mean | 14.8% | 11.2% |
| Median | 13.4% | 10.5% |
| Interquartile 25% (IQ1) | 12.3% | 9.6% |
| Interquartile 75% (IQ3) | 17.9% | 11.1% |
| Interquartile Range (IQR) | 5.6% | 1.6% |
| Standard Deviation (Sample) | 5.0% | 6.0% |
| Standard Deviation (Population) | 4.9% | 6.0% |
Similar Demographics by Divorced or Separated
Demographics Similar to Panamanians by Divorced or Separated
In terms of divorced or separated, the demographic groups most similar to Panamanians are Immigrants from Middle Africa (12.7%, a difference of 0.050%), Ute (12.6%, a difference of 0.060%), Immigrants from Micronesia (12.7%, a difference of 0.16%), Immigrants from Liberia (12.6%, a difference of 0.18%), and Bermudan (12.7%, a difference of 0.18%).
| Demographics | Rating | Rank | Divorced or Separated |
| English | 0.5 /100 | #264 | Tragic 12.6% |
| Immigrants | Senegal | 0.5 /100 | #265 | Tragic 12.6% |
| Whites/Caucasians | 0.5 /100 | #266 | Tragic 12.6% |
| Scottish | 0.4 /100 | #267 | Tragic 12.6% |
| Fijians | 0.4 /100 | #268 | Tragic 12.6% |
| Immigrants | Liberia | 0.4 /100 | #269 | Tragic 12.6% |
| Ute | 0.4 /100 | #270 | Tragic 12.6% |
| Panamanians | 0.3 /100 | #271 | Tragic 12.7% |
| Immigrants | Middle Africa | 0.3 /100 | #272 | Tragic 12.7% |
| Immigrants | Micronesia | 0.3 /100 | #273 | Tragic 12.7% |
| Bermudans | 0.3 /100 | #274 | Tragic 12.7% |
| Central American Indians | 0.3 /100 | #275 | Tragic 12.7% |
| Spaniards | 0.2 /100 | #276 | Tragic 12.7% |
| Dominicans | 0.2 /100 | #277 | Tragic 12.7% |
| Lumbee | 0.2 /100 | #278 | Tragic 12.7% |
Demographics Similar to Immigrants from Pakistan by Divorced or Separated
In terms of divorced or separated, the demographic groups most similar to Immigrants from Pakistan are Vietnamese (10.8%, a difference of 0.18%), Immigrants from Sri Lanka (10.8%, a difference of 0.19%), Iranian (10.8%, a difference of 0.24%), Immigrants from Asia (10.7%, a difference of 0.43%), and Burmese (10.7%, a difference of 0.62%).
| Demographics | Rating | Rank | Divorced or Separated |
| Immigrants | Korea | 100.0 /100 | #16 | Exceptional 10.6% |
| Immigrants | Israel | 100.0 /100 | #17 | Exceptional 10.6% |
| Immigrants | Iran | 100.0 /100 | #18 | Exceptional 10.6% |
| Asians | 100.0 /100 | #19 | Exceptional 10.6% |
| Burmese | 100.0 /100 | #20 | Exceptional 10.7% |
| Immigrants | Asia | 100.0 /100 | #21 | Exceptional 10.7% |
| Vietnamese | 100.0 /100 | #22 | Exceptional 10.8% |
| Immigrants | Pakistan | 100.0 /100 | #23 | Exceptional 10.8% |
| Immigrants | Sri Lanka | 100.0 /100 | #24 | Exceptional 10.8% |
| Iranians | 100.0 /100 | #25 | Exceptional 10.8% |
| Immigrants | Indonesia | 100.0 /100 | #26 | Exceptional 10.9% |
| Immigrants | Bangladesh | 100.0 /100 | #27 | Exceptional 11.0% |
| Immigrants | Malaysia | 100.0 /100 | #28 | Exceptional 11.0% |
| Armenians | 100.0 /100 | #29 | Exceptional 11.0% |
| Immigrants | Ireland | 100.0 /100 | #30 | Exceptional 11.0% |