Panamanian vs Immigrants from Pakistan Median Household Income
COMPARE
Panamanian
Immigrants from Pakistan
Median Household Income
Median Household Income Comparison
Panamanians
Immigrants from Pakistan
$82,272
MEDIAN HOUSEHOLD INCOME
14.0/ 100
METRIC RATING
214th/ 347
METRIC RANK
$97,528
MEDIAN HOUSEHOLD INCOME
100.0/ 100
METRIC RATING
36th/ 347
METRIC RANK
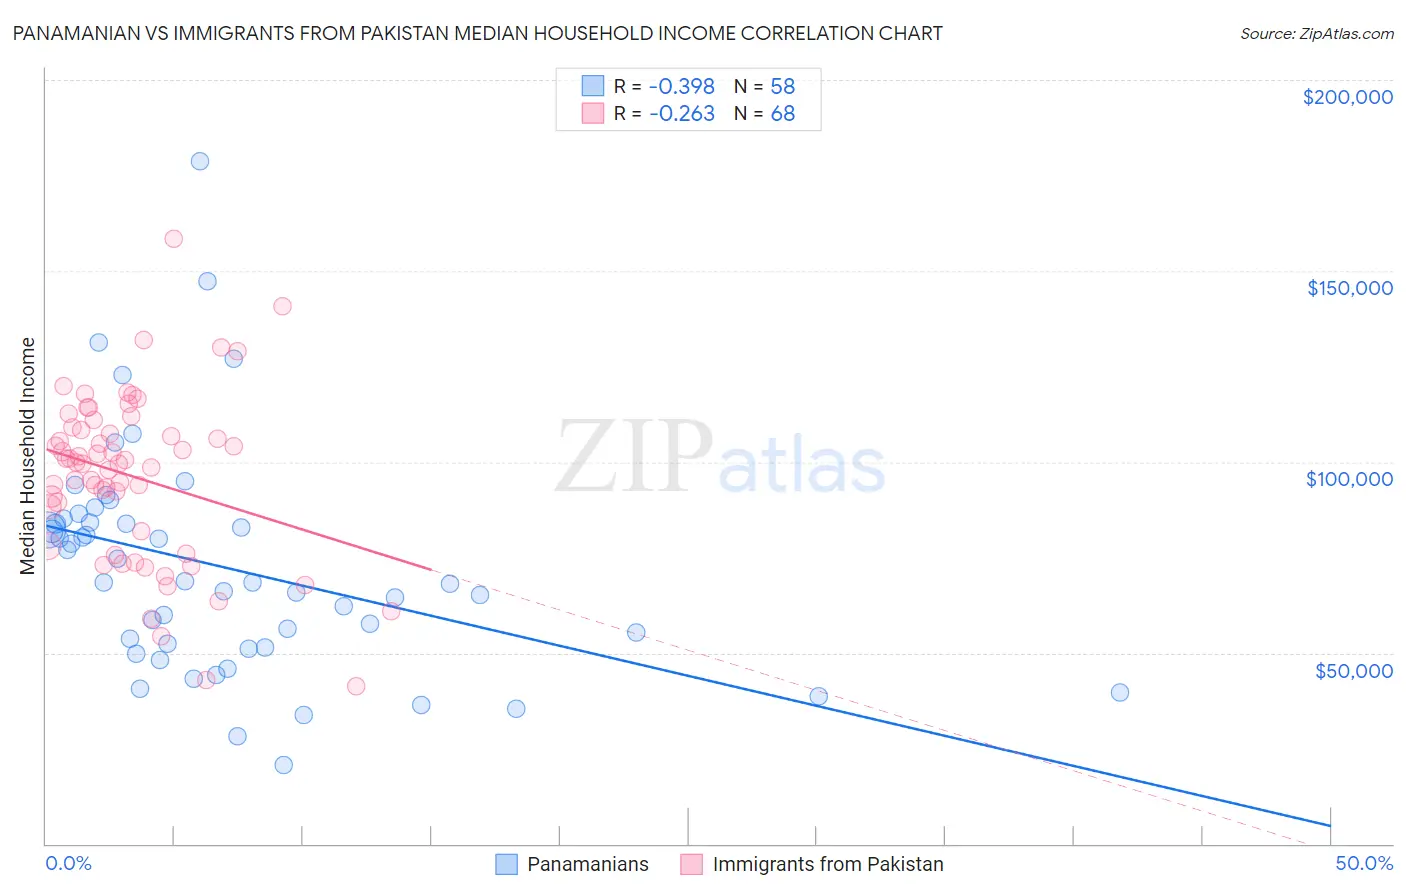
Panamanian vs Immigrants from Pakistan Median Household Income Correlation Chart
The statistical analysis conducted on geographies consisting of 281,034,556 people shows a mild negative correlation between the proportion of Panamanians and median household income in the United States with a correlation coefficient (R) of -0.398 and weighted average of $82,272. Similarly, the statistical analysis conducted on geographies consisting of 283,734,459 people shows a weak negative correlation between the proportion of Immigrants from Pakistan and median household income in the United States with a correlation coefficient (R) of -0.263 and weighted average of $97,528, a difference of 18.5%.
Median Household Income Correlation Summary
| Measurement | Panamanian | Immigrants from Pakistan |
| Minimum | $20,556 | $41,375 |
| Maximum | $178,834 | $158,426 |
| Range | $158,278 | $117,051 |
| Mean | $72,362 | $96,211 |
| Median | $68,346 | $99,663 |
| Interquartile 25% (IQ1) | $51,530 | $79,936 |
| Interquartile 75% (IQ3) | $83,972 | $108,805 |
| Interquartile Range (IQR) | $32,442 | $28,869 |
| Standard Deviation (Sample) | $29,634 | $22,052 |
| Standard Deviation (Population) | $29,377 | $21,889 |
Similar Demographics by Median Household Income
Demographics Similar to Panamanians by Median Household Income
In terms of median household income, the demographic groups most similar to Panamanians are Vietnamese ($82,248, a difference of 0.030%), Yugoslavian ($82,186, a difference of 0.10%), Nepalese ($82,410, a difference of 0.17%), Venezuelan ($82,432, a difference of 0.20%), and Salvadoran ($82,449, a difference of 0.22%).
| Demographics | Rating | Rank | Median Household Income |
| Dutch | 20.3 /100 | #207 | Fair $82,971 |
| French Canadians | 18.7 /100 | #208 | Poor $82,810 |
| Immigrants | Iraq | 16.7 /100 | #209 | Poor $82,594 |
| Immigrants | Uruguay | 16.4 /100 | #210 | Poor $82,560 |
| Salvadorans | 15.4 /100 | #211 | Poor $82,449 |
| Venezuelans | 15.3 /100 | #212 | Poor $82,432 |
| Nepalese | 15.1 /100 | #213 | Poor $82,410 |
| Panamanians | 14.0 /100 | #214 | Poor $82,272 |
| Vietnamese | 13.8 /100 | #215 | Poor $82,248 |
| Yugoslavians | 13.3 /100 | #216 | Poor $82,186 |
| Ecuadorians | 12.5 /100 | #217 | Poor $82,070 |
| Whites/Caucasians | 12.2 /100 | #218 | Poor $82,029 |
| Nigerians | 10.3 /100 | #219 | Poor $81,725 |
| Immigrants | Venezuela | 9.0 /100 | #220 | Tragic $81,506 |
| Immigrants | Ghana | 9.0 /100 | #221 | Tragic $81,489 |
Demographics Similar to Immigrants from Pakistan by Median Household Income
In terms of median household income, the demographic groups most similar to Immigrants from Pakistan are Latvian ($97,311, a difference of 0.22%), Immigrants from Indonesia ($97,297, a difference of 0.24%), Immigrants from Switzerland ($97,979, a difference of 0.46%), Russian ($98,008, a difference of 0.49%), and Afghan ($97,026, a difference of 0.52%).
| Demographics | Rating | Rank | Median Household Income |
| Immigrants | Asia | 100.0 /100 | #29 | Exceptional $99,933 |
| Immigrants | Northern Europe | 100.0 /100 | #30 | Exceptional $99,813 |
| Turks | 100.0 /100 | #31 | Exceptional $99,389 |
| Immigrants | Denmark | 100.0 /100 | #32 | Exceptional $98,510 |
| Chinese | 100.0 /100 | #33 | Exceptional $98,496 |
| Russians | 100.0 /100 | #34 | Exceptional $98,008 |
| Immigrants | Switzerland | 100.0 /100 | #35 | Exceptional $97,979 |
| Immigrants | Pakistan | 100.0 /100 | #36 | Exceptional $97,528 |
| Latvians | 100.0 /100 | #37 | Exceptional $97,311 |
| Immigrants | Indonesia | 100.0 /100 | #38 | Exceptional $97,297 |
| Afghans | 100.0 /100 | #39 | Exceptional $97,026 |
| Maltese | 100.0 /100 | #40 | Exceptional $97,015 |
| Immigrants | Turkey | 100.0 /100 | #41 | Exceptional $96,964 |
| Immigrants | Lithuania | 99.9 /100 | #42 | Exceptional $96,836 |
| Immigrants | France | 99.9 /100 | #43 | Exceptional $96,743 |