Panamanian vs Ecuadorian Median Male Earnings
COMPARE
Panamanian
Ecuadorian
Median Male Earnings
Median Male Earnings Comparison
Panamanians
Ecuadorians
$52,835
MEDIAN MALE EARNINGS
16.5/ 100
METRIC RATING
203rd/ 347
METRIC RANK
$51,596
MEDIAN MALE EARNINGS
5.5/ 100
METRIC RATING
223rd/ 347
METRIC RANK
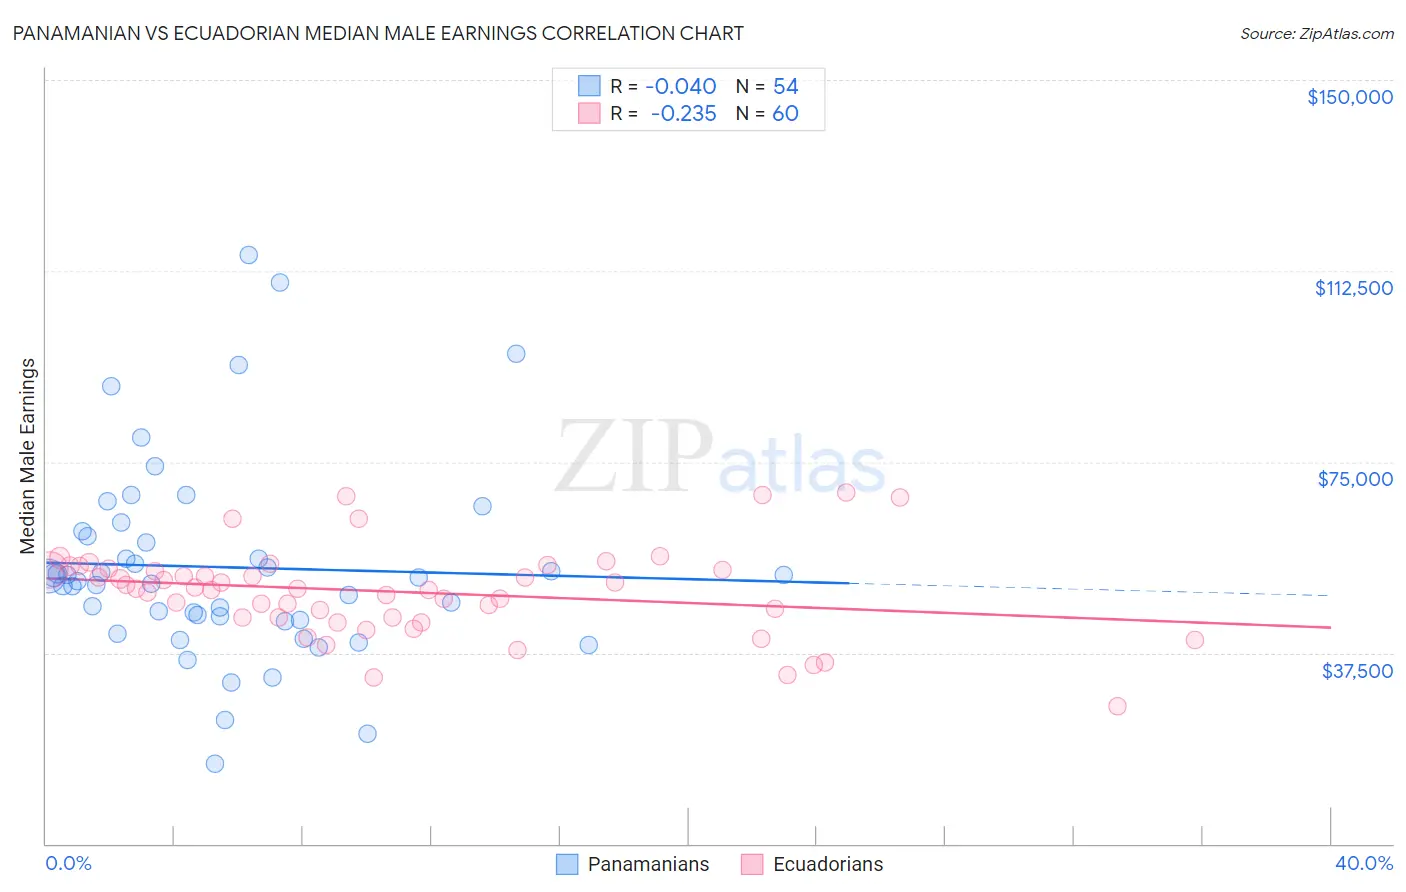
Panamanian vs Ecuadorian Median Male Earnings Correlation Chart
The statistical analysis conducted on geographies consisting of 281,209,556 people shows no correlation between the proportion of Panamanians and median male earnings in the United States with a correlation coefficient (R) of -0.040 and weighted average of $52,835. Similarly, the statistical analysis conducted on geographies consisting of 317,782,884 people shows a weak negative correlation between the proportion of Ecuadorians and median male earnings in the United States with a correlation coefficient (R) of -0.235 and weighted average of $51,596, a difference of 2.4%.
Median Male Earnings Correlation Summary
| Measurement | Panamanian | Ecuadorian |
| Minimum | $15,735 | $27,125 |
| Maximum | $115,625 | $69,080 |
| Range | $99,890 | $41,955 |
| Mean | $54,298 | $49,474 |
| Median | $51,973 | $50,085 |
| Interquartile 25% (IQ1) | $43,917 | $44,427 |
| Interquartile 75% (IQ3) | $60,350 | $53,952 |
| Interquartile Range (IQR) | $16,433 | $9,525 |
| Standard Deviation (Sample) | $19,573 | $8,750 |
| Standard Deviation (Population) | $19,391 | $8,677 |
Demographics Similar to Panamanians and Ecuadorians by Median Male Earnings
In terms of median male earnings, the demographic groups most similar to Panamanians are Ghanaian ($52,810, a difference of 0.050%), Immigrants from Colombia ($52,725, a difference of 0.21%), Immigrants from Iraq ($52,681, a difference of 0.29%), Vietnamese ($52,525, a difference of 0.59%), and Venezuelan ($52,510, a difference of 0.62%). Similarly, the demographic groups most similar to Ecuadorians are Immigrants from Bangladesh ($51,642, a difference of 0.090%), Immigrants from Senegal ($51,647, a difference of 0.10%), Immigrants from Armenia ($51,793, a difference of 0.38%), Immigrants from Ghana ($51,836, a difference of 0.47%), and Immigrants from Panama ($51,962, a difference of 0.71%).
| Demographics | Rating | Rank | Median Male Earnings |
| Panamanians | 16.5 /100 | #203 | Poor $52,835 |
| Ghanaians | 16.1 /100 | #204 | Poor $52,810 |
| Immigrants | Colombia | 15.0 /100 | #205 | Poor $52,725 |
| Immigrants | Iraq | 14.5 /100 | #206 | Poor $52,681 |
| Vietnamese | 12.7 /100 | #207 | Poor $52,525 |
| Venezuelans | 12.5 /100 | #208 | Poor $52,510 |
| Bermudans | 12.1 /100 | #209 | Poor $52,465 |
| Delaware | 11.5 /100 | #210 | Poor $52,412 |
| Tlingit-Haida | 11.5 /100 | #211 | Poor $52,409 |
| Cajuns | 10.7 /100 | #212 | Poor $52,325 |
| Native Hawaiians | 10.5 /100 | #213 | Poor $52,306 |
| Immigrants | Nonimmigrants | 9.3 /100 | #214 | Tragic $52,170 |
| Immigrants | Cameroon | 8.9 /100 | #215 | Tragic $52,119 |
| Immigrants | Venezuela | 8.3 /100 | #216 | Tragic $52,041 |
| Nigerians | 8.3 /100 | #217 | Tragic $52,039 |
| Immigrants | Panama | 7.7 /100 | #218 | Tragic $51,962 |
| Immigrants | Ghana | 6.9 /100 | #219 | Tragic $51,836 |
| Immigrants | Armenia | 6.6 /100 | #220 | Tragic $51,793 |
| Immigrants | Senegal | 5.8 /100 | #221 | Tragic $51,647 |
| Immigrants | Bangladesh | 5.8 /100 | #222 | Tragic $51,642 |
| Ecuadorians | 5.5 /100 | #223 | Tragic $51,596 |