Immigrants from Middle Africa vs Immigrants from Pakistan Median Household Income
COMPARE
Immigrants from Middle Africa
Immigrants from Pakistan
Median Household Income
Median Household Income Comparison
Immigrants from Middle Africa
Immigrants from Pakistan
$77,559
MEDIAN HOUSEHOLD INCOME
0.8/ 100
METRIC RATING
255th/ 347
METRIC RANK
$97,528
MEDIAN HOUSEHOLD INCOME
100.0/ 100
METRIC RATING
36th/ 347
METRIC RANK
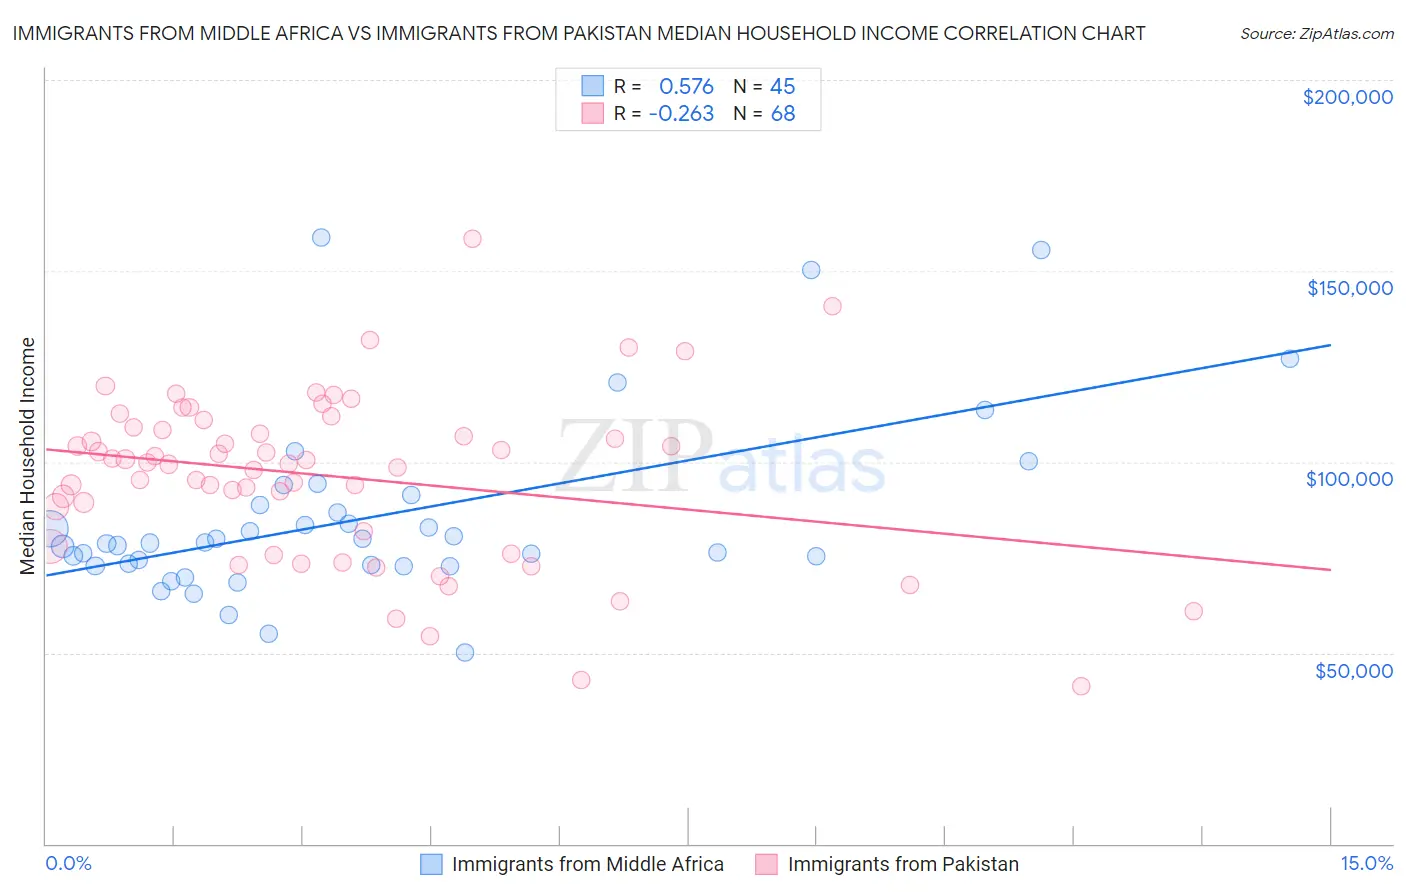
Immigrants from Middle Africa vs Immigrants from Pakistan Median Household Income Correlation Chart
The statistical analysis conducted on geographies consisting of 202,637,900 people shows a substantial positive correlation between the proportion of Immigrants from Middle Africa and median household income in the United States with a correlation coefficient (R) of 0.576 and weighted average of $77,559. Similarly, the statistical analysis conducted on geographies consisting of 283,734,459 people shows a weak negative correlation between the proportion of Immigrants from Pakistan and median household income in the United States with a correlation coefficient (R) of -0.263 and weighted average of $97,528, a difference of 25.8%.
Median Household Income Correlation Summary
| Measurement | Immigrants from Middle Africa | Immigrants from Pakistan |
| Minimum | $50,020 | $41,375 |
| Maximum | $158,604 | $158,426 |
| Range | $108,584 | $117,051 |
| Mean | $85,598 | $96,211 |
| Median | $78,726 | $99,663 |
| Interquartile 25% (IQ1) | $72,847 | $79,936 |
| Interquartile 75% (IQ3) | $90,002 | $108,805 |
| Interquartile Range (IQR) | $17,155 | $28,869 |
| Standard Deviation (Sample) | $23,894 | $22,052 |
| Standard Deviation (Population) | $23,627 | $21,889 |
Similar Demographics by Median Household Income
Demographics Similar to Immigrants from Middle Africa by Median Household Income
In terms of median household income, the demographic groups most similar to Immigrants from Middle Africa are Subsaharan African ($77,631, a difference of 0.090%), Immigrants from St. Vincent and the Grenadines ($77,690, a difference of 0.17%), Immigrants from West Indies ($77,956, a difference of 0.51%), Belizean ($77,028, a difference of 0.69%), and Mexican American Indian ($78,166, a difference of 0.78%).
| Demographics | Rating | Rank | Median Household Income |
| Sudanese | 1.5 /100 | #248 | Tragic $78,529 |
| West Indians | 1.4 /100 | #249 | Tragic $78,455 |
| Immigrants | Laos | 1.3 /100 | #250 | Tragic $78,327 |
| Mexican American Indians | 1.2 /100 | #251 | Tragic $78,166 |
| Immigrants | West Indies | 1.0 /100 | #252 | Tragic $77,956 |
| Immigrants | St. Vincent and the Grenadines | 0.9 /100 | #253 | Tragic $77,690 |
| Sub-Saharan Africans | 0.8 /100 | #254 | Tragic $77,631 |
| Immigrants | Middle Africa | 0.8 /100 | #255 | Tragic $77,559 |
| Belizeans | 0.6 /100 | #256 | Tragic $77,028 |
| Immigrants | Senegal | 0.5 /100 | #257 | Tragic $76,915 |
| Immigrants | Nicaragua | 0.5 /100 | #258 | Tragic $76,784 |
| Spanish American Indians | 0.4 /100 | #259 | Tragic $76,670 |
| Jamaicans | 0.4 /100 | #260 | Tragic $76,583 |
| Immigrants | Grenada | 0.4 /100 | #261 | Tragic $76,517 |
| French American Indians | 0.4 /100 | #262 | Tragic $76,387 |
Demographics Similar to Immigrants from Pakistan by Median Household Income
In terms of median household income, the demographic groups most similar to Immigrants from Pakistan are Latvian ($97,311, a difference of 0.22%), Immigrants from Indonesia ($97,297, a difference of 0.24%), Immigrants from Switzerland ($97,979, a difference of 0.46%), Russian ($98,008, a difference of 0.49%), and Afghan ($97,026, a difference of 0.52%).
| Demographics | Rating | Rank | Median Household Income |
| Immigrants | Asia | 100.0 /100 | #29 | Exceptional $99,933 |
| Immigrants | Northern Europe | 100.0 /100 | #30 | Exceptional $99,813 |
| Turks | 100.0 /100 | #31 | Exceptional $99,389 |
| Immigrants | Denmark | 100.0 /100 | #32 | Exceptional $98,510 |
| Chinese | 100.0 /100 | #33 | Exceptional $98,496 |
| Russians | 100.0 /100 | #34 | Exceptional $98,008 |
| Immigrants | Switzerland | 100.0 /100 | #35 | Exceptional $97,979 |
| Immigrants | Pakistan | 100.0 /100 | #36 | Exceptional $97,528 |
| Latvians | 100.0 /100 | #37 | Exceptional $97,311 |
| Immigrants | Indonesia | 100.0 /100 | #38 | Exceptional $97,297 |
| Afghans | 100.0 /100 | #39 | Exceptional $97,026 |
| Maltese | 100.0 /100 | #40 | Exceptional $97,015 |
| Immigrants | Turkey | 100.0 /100 | #41 | Exceptional $96,964 |
| Immigrants | Lithuania | 99.9 /100 | #42 | Exceptional $96,836 |
| Immigrants | France | 99.9 /100 | #43 | Exceptional $96,743 |