Immigrants from Austria vs Immigrants from Pakistan Median Household Income
COMPARE
Immigrants from Austria
Immigrants from Pakistan
Median Household Income
Median Household Income Comparison
Immigrants from Austria
Immigrants from Pakistan
$95,277
MEDIAN HOUSEHOLD INCOME
99.9/ 100
METRIC RATING
56th/ 347
METRIC RANK
$97,528
MEDIAN HOUSEHOLD INCOME
100.0/ 100
METRIC RATING
36th/ 347
METRIC RANK
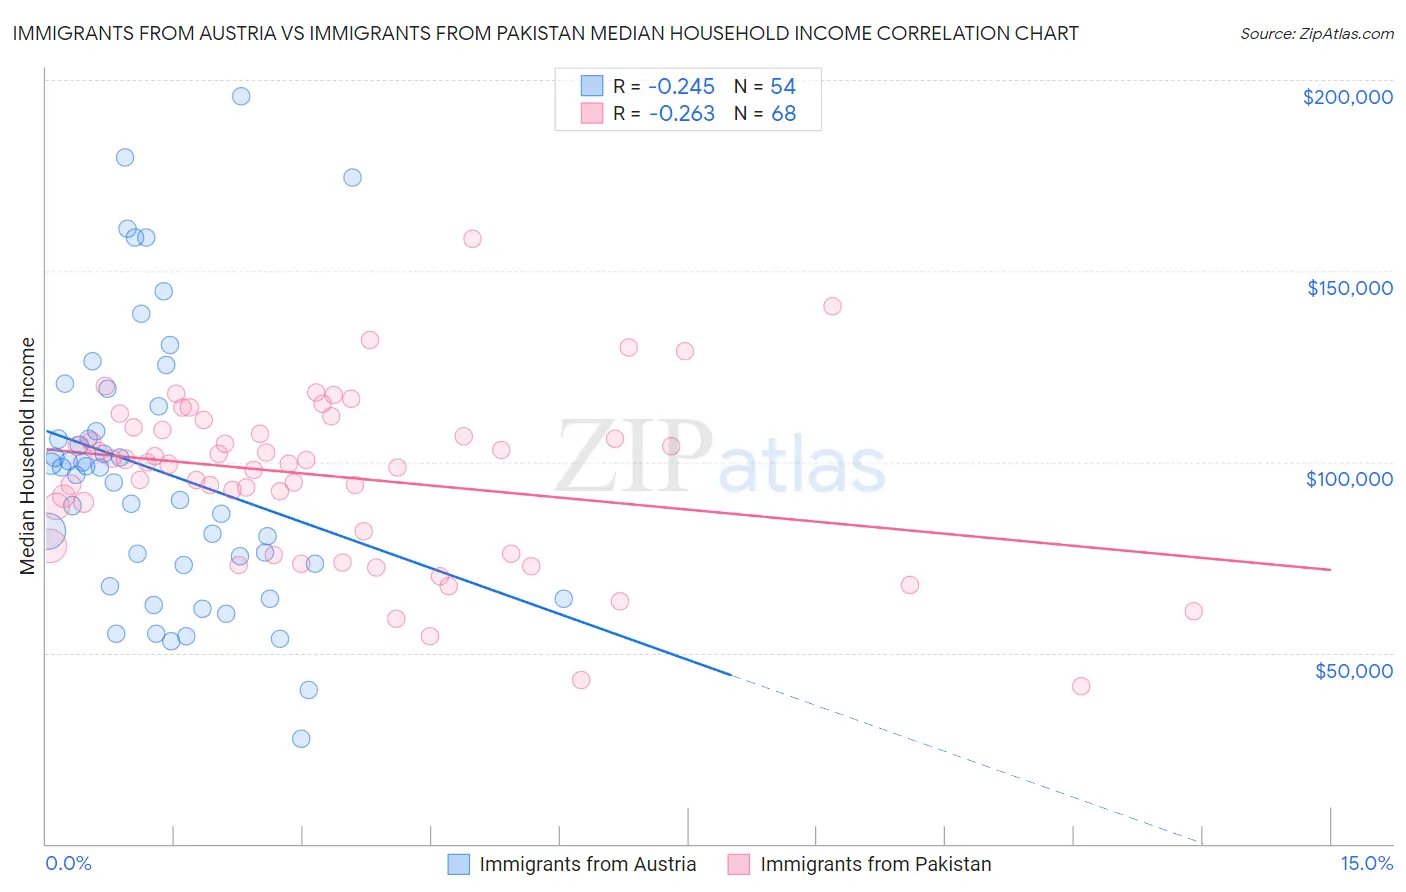
Immigrants from Austria vs Immigrants from Pakistan Median Household Income Correlation Chart
The statistical analysis conducted on geographies consisting of 167,955,679 people shows a weak negative correlation between the proportion of Immigrants from Austria and median household income in the United States with a correlation coefficient (R) of -0.245 and weighted average of $95,277. Similarly, the statistical analysis conducted on geographies consisting of 283,734,459 people shows a weak negative correlation between the proportion of Immigrants from Pakistan and median household income in the United States with a correlation coefficient (R) of -0.263 and weighted average of $97,528, a difference of 2.4%.
Median Household Income Correlation Summary
| Measurement | Immigrants from Austria | Immigrants from Pakistan |
| Minimum | $27,500 | $41,375 |
| Maximum | $195,784 | $158,426 |
| Range | $168,284 | $117,051 |
| Mean | $97,293 | $96,211 |
| Median | $97,556 | $99,663 |
| Interquartile 25% (IQ1) | $73,089 | $79,936 |
| Interquartile 75% (IQ3) | $114,543 | $108,805 |
| Interquartile Range (IQR) | $41,455 | $28,869 |
| Standard Deviation (Sample) | $36,453 | $22,052 |
| Standard Deviation (Population) | $36,114 | $21,889 |
Demographics Similar to Immigrants from Austria and Immigrants from Pakistan by Median Household Income
In terms of median household income, the demographic groups most similar to Immigrants from Austria are Immigrants from Czechoslovakia ($95,319, a difference of 0.040%), Egyptian ($95,673, a difference of 0.42%), Paraguayan ($95,737, a difference of 0.48%), Immigrants from South Africa ($95,800, a difference of 0.55%), and Estonian ($95,930, a difference of 0.69%). Similarly, the demographic groups most similar to Immigrants from Pakistan are Latvian ($97,311, a difference of 0.22%), Immigrants from Indonesia ($97,297, a difference of 0.24%), Afghan ($97,026, a difference of 0.52%), Maltese ($97,015, a difference of 0.53%), and Immigrants from Turkey ($96,964, a difference of 0.58%).
| Demographics | Rating | Rank | Median Household Income |
| Immigrants | Pakistan | 100.0 /100 | #36 | Exceptional $97,528 |
| Latvians | 100.0 /100 | #37 | Exceptional $97,311 |
| Immigrants | Indonesia | 100.0 /100 | #38 | Exceptional $97,297 |
| Afghans | 100.0 /100 | #39 | Exceptional $97,026 |
| Maltese | 100.0 /100 | #40 | Exceptional $97,015 |
| Immigrants | Turkey | 100.0 /100 | #41 | Exceptional $96,964 |
| Immigrants | Lithuania | 99.9 /100 | #42 | Exceptional $96,836 |
| Immigrants | France | 99.9 /100 | #43 | Exceptional $96,743 |
| Immigrants | Greece | 99.9 /100 | #44 | Exceptional $96,675 |
| Israelis | 99.9 /100 | #45 | Exceptional $96,552 |
| Australians | 99.9 /100 | #46 | Exceptional $96,490 |
| Immigrants | Russia | 99.9 /100 | #47 | Exceptional $96,378 |
| Cambodians | 99.9 /100 | #48 | Exceptional $96,324 |
| Immigrants | Malaysia | 99.9 /100 | #49 | Exceptional $96,292 |
| Bulgarians | 99.9 /100 | #50 | Exceptional $96,290 |
| Estonians | 99.9 /100 | #51 | Exceptional $95,930 |
| Immigrants | South Africa | 99.9 /100 | #52 | Exceptional $95,800 |
| Paraguayans | 99.9 /100 | #53 | Exceptional $95,737 |
| Egyptians | 99.9 /100 | #54 | Exceptional $95,673 |
| Immigrants | Czechoslovakia | 99.9 /100 | #55 | Exceptional $95,319 |
| Immigrants | Austria | 99.9 /100 | #56 | Exceptional $95,277 |