Immigrants from Laos vs Immigrants from Pakistan Median Household Income
COMPARE
Immigrants from Laos
Immigrants from Pakistan
Median Household Income
Median Household Income Comparison
Immigrants from Laos
Immigrants from Pakistan
$78,327
MEDIAN HOUSEHOLD INCOME
1.3/ 100
METRIC RATING
250th/ 347
METRIC RANK
$97,528
MEDIAN HOUSEHOLD INCOME
100.0/ 100
METRIC RATING
36th/ 347
METRIC RANK
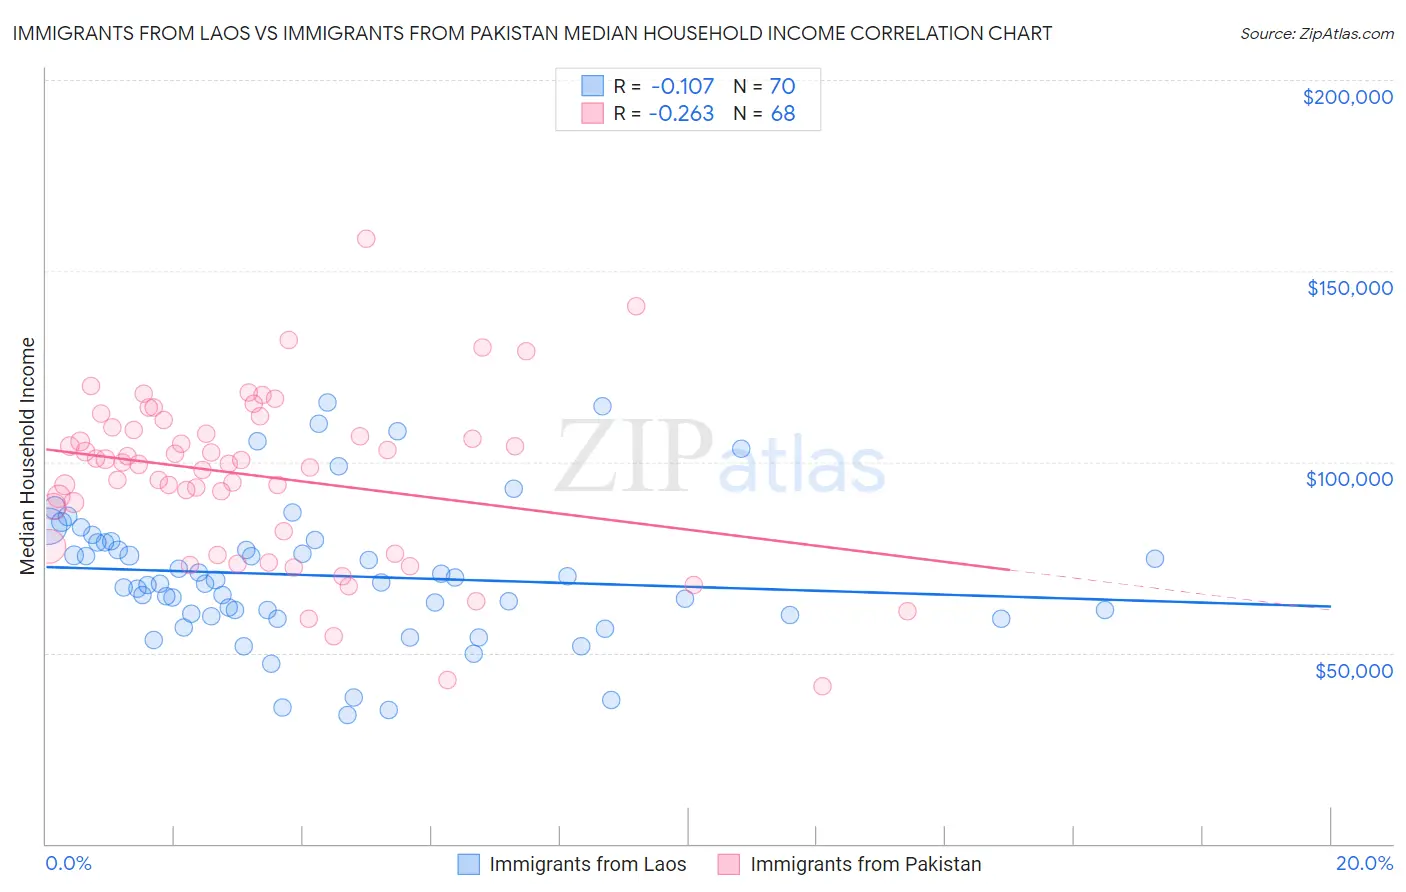
Immigrants from Laos vs Immigrants from Pakistan Median Household Income Correlation Chart
The statistical analysis conducted on geographies consisting of 201,460,424 people shows a poor negative correlation between the proportion of Immigrants from Laos and median household income in the United States with a correlation coefficient (R) of -0.107 and weighted average of $78,327. Similarly, the statistical analysis conducted on geographies consisting of 283,734,459 people shows a weak negative correlation between the proportion of Immigrants from Pakistan and median household income in the United States with a correlation coefficient (R) of -0.263 and weighted average of $97,528, a difference of 24.5%.
Median Household Income Correlation Summary
| Measurement | Immigrants from Laos | Immigrants from Pakistan |
| Minimum | $33,804 | $41,375 |
| Maximum | $115,579 | $158,426 |
| Range | $81,775 | $117,051 |
| Mean | $70,206 | $96,211 |
| Median | $68,245 | $99,663 |
| Interquartile 25% (IQ1) | $59,790 | $79,936 |
| Interquartile 75% (IQ3) | $78,877 | $108,805 |
| Interquartile Range (IQR) | $19,087 | $28,869 |
| Standard Deviation (Sample) | $18,088 | $22,052 |
| Standard Deviation (Population) | $17,959 | $21,889 |
Similar Demographics by Median Household Income
Demographics Similar to Immigrants from Laos by Median Household Income
In terms of median household income, the demographic groups most similar to Immigrants from Laos are West Indian ($78,455, a difference of 0.16%), Mexican American Indian ($78,166, a difference of 0.21%), Sudanese ($78,529, a difference of 0.26%), Immigrants from Burma/Myanmar ($78,682, a difference of 0.45%), and Immigrants from West Indies ($77,956, a difference of 0.48%).
| Demographics | Rating | Rank | Median Household Income |
| Immigrants | Barbados | 1.9 /100 | #243 | Tragic $78,989 |
| Marshallese | 1.9 /100 | #244 | Tragic $78,930 |
| Inupiat | 1.8 /100 | #245 | Tragic $78,841 |
| Central Americans | 1.7 /100 | #246 | Tragic $78,803 |
| Immigrants | Burma/Myanmar | 1.6 /100 | #247 | Tragic $78,682 |
| Sudanese | 1.5 /100 | #248 | Tragic $78,529 |
| West Indians | 1.4 /100 | #249 | Tragic $78,455 |
| Immigrants | Laos | 1.3 /100 | #250 | Tragic $78,327 |
| Mexican American Indians | 1.2 /100 | #251 | Tragic $78,166 |
| Immigrants | West Indies | 1.0 /100 | #252 | Tragic $77,956 |
| Immigrants | St. Vincent and the Grenadines | 0.9 /100 | #253 | Tragic $77,690 |
| Sub-Saharan Africans | 0.8 /100 | #254 | Tragic $77,631 |
| Immigrants | Middle Africa | 0.8 /100 | #255 | Tragic $77,559 |
| Belizeans | 0.6 /100 | #256 | Tragic $77,028 |
| Immigrants | Senegal | 0.5 /100 | #257 | Tragic $76,915 |
Demographics Similar to Immigrants from Pakistan by Median Household Income
In terms of median household income, the demographic groups most similar to Immigrants from Pakistan are Latvian ($97,311, a difference of 0.22%), Immigrants from Indonesia ($97,297, a difference of 0.24%), Immigrants from Switzerland ($97,979, a difference of 0.46%), Russian ($98,008, a difference of 0.49%), and Afghan ($97,026, a difference of 0.52%).
| Demographics | Rating | Rank | Median Household Income |
| Immigrants | Asia | 100.0 /100 | #29 | Exceptional $99,933 |
| Immigrants | Northern Europe | 100.0 /100 | #30 | Exceptional $99,813 |
| Turks | 100.0 /100 | #31 | Exceptional $99,389 |
| Immigrants | Denmark | 100.0 /100 | #32 | Exceptional $98,510 |
| Chinese | 100.0 /100 | #33 | Exceptional $98,496 |
| Russians | 100.0 /100 | #34 | Exceptional $98,008 |
| Immigrants | Switzerland | 100.0 /100 | #35 | Exceptional $97,979 |
| Immigrants | Pakistan | 100.0 /100 | #36 | Exceptional $97,528 |
| Latvians | 100.0 /100 | #37 | Exceptional $97,311 |
| Immigrants | Indonesia | 100.0 /100 | #38 | Exceptional $97,297 |
| Afghans | 100.0 /100 | #39 | Exceptional $97,026 |
| Maltese | 100.0 /100 | #40 | Exceptional $97,015 |
| Immigrants | Turkey | 100.0 /100 | #41 | Exceptional $96,964 |
| Immigrants | Lithuania | 99.9 /100 | #42 | Exceptional $96,836 |
| Immigrants | France | 99.9 /100 | #43 | Exceptional $96,743 |