Panamanian vs Italian Median Household Income
COMPARE
Panamanian
Italian
Median Household Income
Median Household Income Comparison
Panamanians
Italians
$82,272
MEDIAN HOUSEHOLD INCOME
14.0/ 100
METRIC RATING
214th/ 347
METRIC RANK
$92,475
MEDIAN HOUSEHOLD INCOME
99.1/ 100
METRIC RATING
83rd/ 347
METRIC RANK
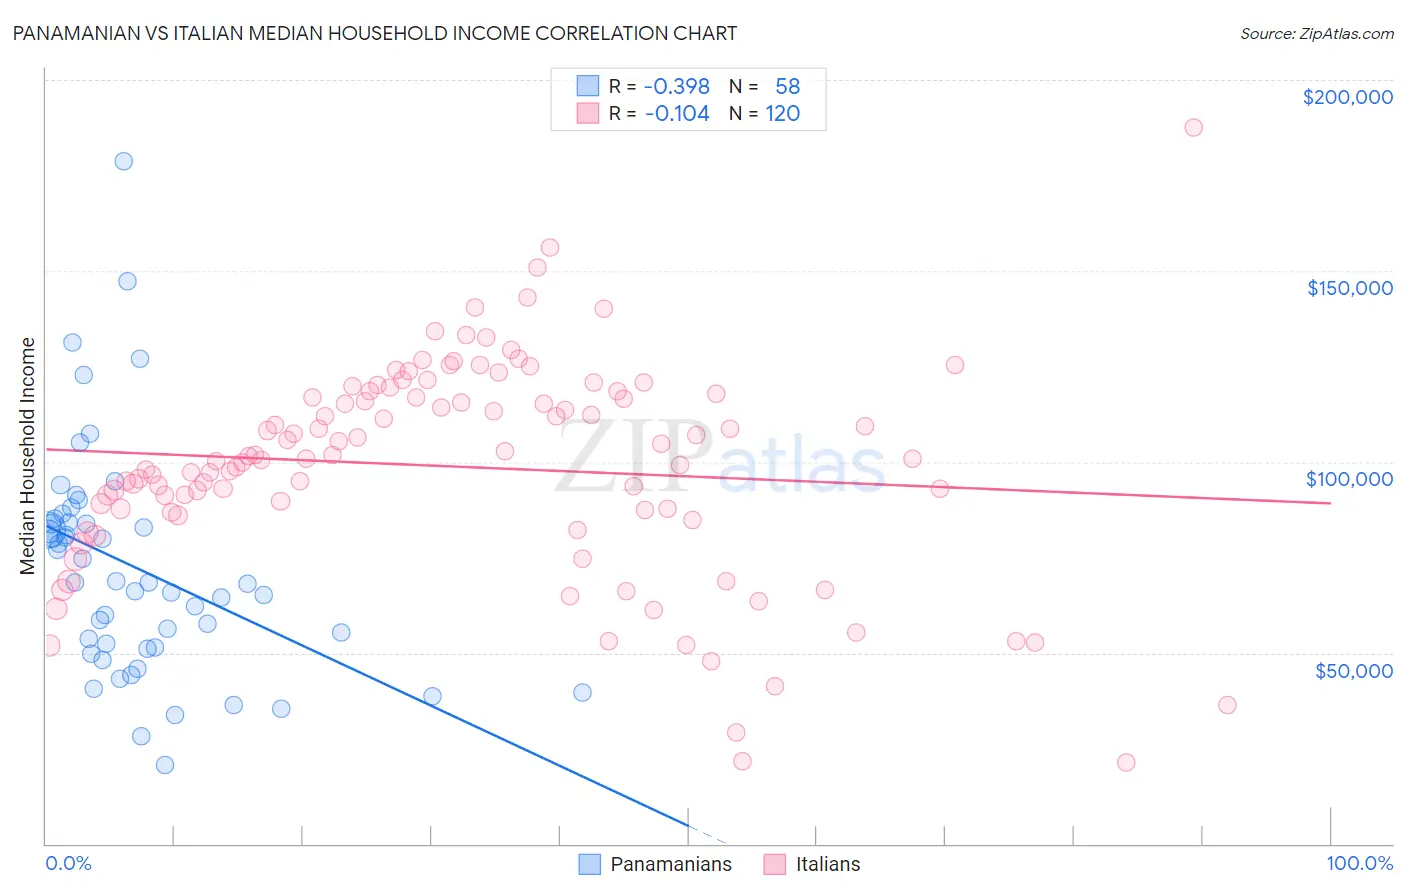
Panamanian vs Italian Median Household Income Correlation Chart
The statistical analysis conducted on geographies consisting of 281,034,556 people shows a mild negative correlation between the proportion of Panamanians and median household income in the United States with a correlation coefficient (R) of -0.398 and weighted average of $82,272. Similarly, the statistical analysis conducted on geographies consisting of 573,867,135 people shows a poor negative correlation between the proportion of Italians and median household income in the United States with a correlation coefficient (R) of -0.104 and weighted average of $92,475, a difference of 12.4%.
Median Household Income Correlation Summary
| Measurement | Panamanian | Italian |
| Minimum | $20,556 | $21,250 |
| Maximum | $178,834 | $187,614 |
| Range | $158,278 | $166,364 |
| Mean | $72,362 | $98,796 |
| Median | $68,346 | $100,721 |
| Interquartile 25% (IQ1) | $51,530 | $86,997 |
| Interquartile 75% (IQ3) | $83,972 | $117,408 |
| Interquartile Range (IQR) | $32,442 | $30,412 |
| Standard Deviation (Sample) | $29,634 | $27,952 |
| Standard Deviation (Population) | $29,377 | $27,836 |
Similar Demographics by Median Household Income
Demographics Similar to Panamanians by Median Household Income
In terms of median household income, the demographic groups most similar to Panamanians are Vietnamese ($82,248, a difference of 0.030%), Yugoslavian ($82,186, a difference of 0.10%), Nepalese ($82,410, a difference of 0.17%), Venezuelan ($82,432, a difference of 0.20%), and Salvadoran ($82,449, a difference of 0.22%).
| Demographics | Rating | Rank | Median Household Income |
| Dutch | 20.3 /100 | #207 | Fair $82,971 |
| French Canadians | 18.7 /100 | #208 | Poor $82,810 |
| Immigrants | Iraq | 16.7 /100 | #209 | Poor $82,594 |
| Immigrants | Uruguay | 16.4 /100 | #210 | Poor $82,560 |
| Salvadorans | 15.4 /100 | #211 | Poor $82,449 |
| Venezuelans | 15.3 /100 | #212 | Poor $82,432 |
| Nepalese | 15.1 /100 | #213 | Poor $82,410 |
| Panamanians | 14.0 /100 | #214 | Poor $82,272 |
| Vietnamese | 13.8 /100 | #215 | Poor $82,248 |
| Yugoslavians | 13.3 /100 | #216 | Poor $82,186 |
| Ecuadorians | 12.5 /100 | #217 | Poor $82,070 |
| Whites/Caucasians | 12.2 /100 | #218 | Poor $82,029 |
| Nigerians | 10.3 /100 | #219 | Poor $81,725 |
| Immigrants | Venezuela | 9.0 /100 | #220 | Tragic $81,506 |
| Immigrants | Ghana | 9.0 /100 | #221 | Tragic $81,489 |
Demographics Similar to Italians by Median Household Income
In terms of median household income, the demographic groups most similar to Italians are Immigrants from Argentina ($92,417, a difference of 0.060%), Immigrants from Croatia ($92,225, a difference of 0.27%), Immigrants from Spain ($92,732, a difference of 0.28%), Immigrants from England ($92,098, a difference of 0.41%), and Immigrants from Hungary ($92,094, a difference of 0.41%).
| Demographics | Rating | Rank | Median Household Income |
| South Africans | 99.5 /100 | #76 | Exceptional $93,379 |
| Immigrants | Afghanistan | 99.5 /100 | #77 | Exceptional $93,375 |
| Immigrants | Bulgaria | 99.4 /100 | #78 | Exceptional $93,148 |
| Sri Lankans | 99.4 /100 | #79 | Exceptional $93,093 |
| Tongans | 99.4 /100 | #80 | Exceptional $93,076 |
| Immigrants | Eastern Europe | 99.4 /100 | #81 | Exceptional $93,051 |
| Immigrants | Spain | 99.3 /100 | #82 | Exceptional $92,732 |
| Italians | 99.1 /100 | #83 | Exceptional $92,475 |
| Immigrants | Argentina | 99.1 /100 | #84 | Exceptional $92,417 |
| Immigrants | Croatia | 99.0 /100 | #85 | Exceptional $92,225 |
| Immigrants | England | 98.9 /100 | #86 | Exceptional $92,098 |
| Immigrants | Hungary | 98.9 /100 | #87 | Exceptional $92,094 |
| Immigrants | Canada | 98.8 /100 | #88 | Exceptional $92,029 |
| Romanians | 98.8 /100 | #89 | Exceptional $91,994 |
| Assyrians/Chaldeans/Syriacs | 98.8 /100 | #90 | Exceptional $91,991 |