Immigrants from Poland vs Immigrants from Pakistan Median Household Income
COMPARE
Immigrants from Poland
Immigrants from Pakistan
Median Household Income
Median Household Income Comparison
Immigrants from Poland
Immigrants from Pakistan
$90,549
MEDIAN HOUSEHOLD INCOME
97.1/ 100
METRIC RATING
111th/ 347
METRIC RANK
$97,528
MEDIAN HOUSEHOLD INCOME
100.0/ 100
METRIC RATING
36th/ 347
METRIC RANK
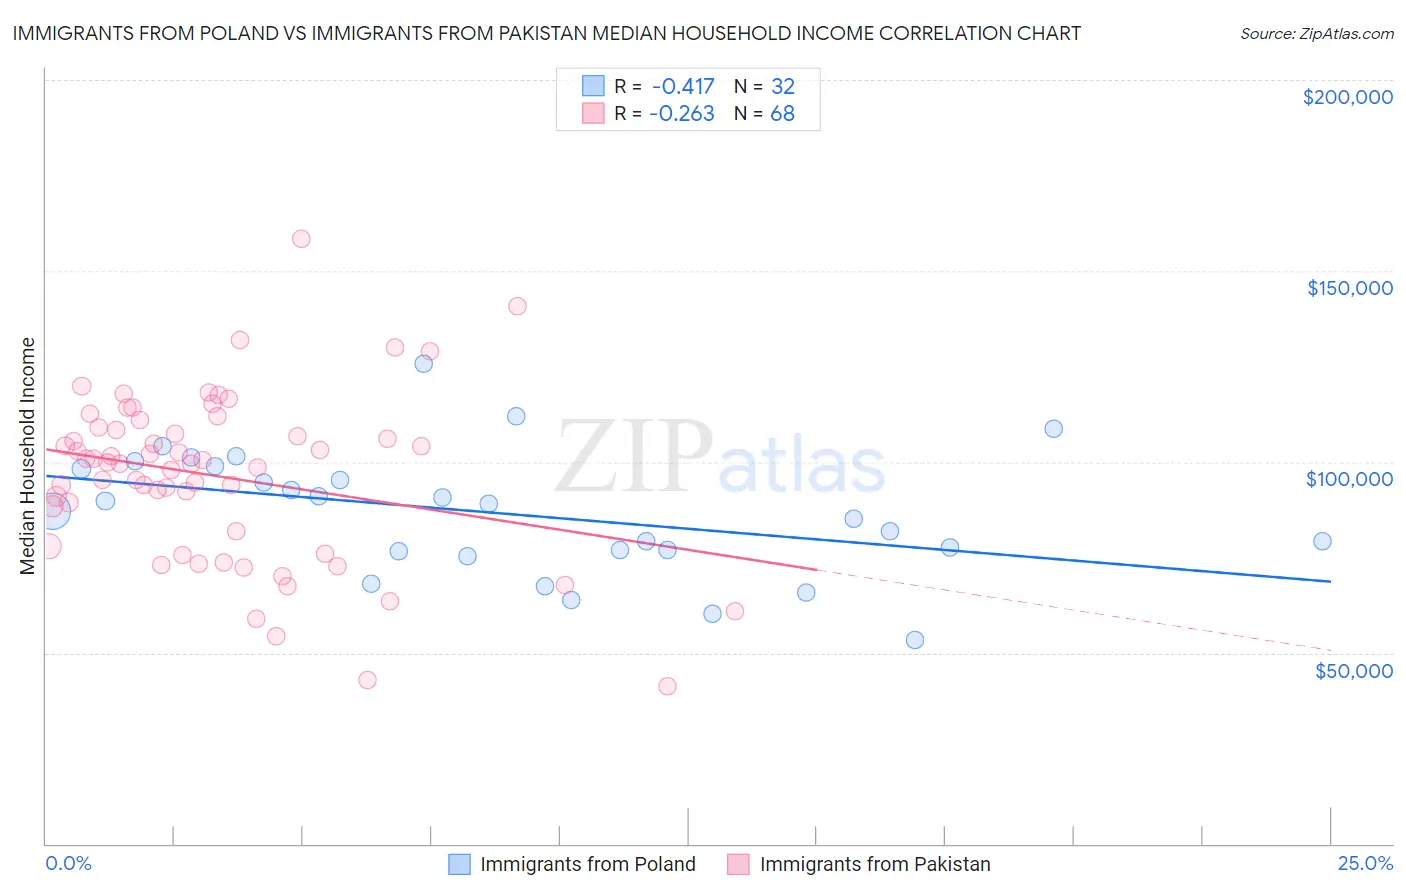
Immigrants from Poland vs Immigrants from Pakistan Median Household Income Correlation Chart
The statistical analysis conducted on geographies consisting of 304,762,880 people shows a moderate negative correlation between the proportion of Immigrants from Poland and median household income in the United States with a correlation coefficient (R) of -0.417 and weighted average of $90,549. Similarly, the statistical analysis conducted on geographies consisting of 283,734,459 people shows a weak negative correlation between the proportion of Immigrants from Pakistan and median household income in the United States with a correlation coefficient (R) of -0.263 and weighted average of $97,528, a difference of 7.7%.
Median Household Income Correlation Summary
| Measurement | Immigrants from Poland | Immigrants from Pakistan |
| Minimum | $53,329 | $41,375 |
| Maximum | $125,589 | $158,426 |
| Range | $72,260 | $117,051 |
| Mean | $86,504 | $96,211 |
| Median | $88,122 | $99,663 |
| Interquartile 25% (IQ1) | $76,692 | $79,936 |
| Interquartile 75% (IQ3) | $98,535 | $108,805 |
| Interquartile Range (IQR) | $21,843 | $28,869 |
| Standard Deviation (Sample) | $16,261 | $22,052 |
| Standard Deviation (Population) | $16,005 | $21,889 |
Similar Demographics by Median Household Income
Demographics Similar to Immigrants from Poland by Median Household Income
In terms of median household income, the demographic groups most similar to Immigrants from Poland are Palestinian ($90,574, a difference of 0.030%), Chilean ($90,605, a difference of 0.060%), Zimbabwean ($90,618, a difference of 0.080%), Northern European ($90,446, a difference of 0.11%), and Croatian ($90,685, a difference of 0.15%).
| Demographics | Rating | Rank | Median Household Income |
| Immigrants | Kazakhstan | 97.8 /100 | #104 | Exceptional $91,015 |
| Immigrants | Brazil | 97.7 /100 | #105 | Exceptional $90,907 |
| Macedonians | 97.4 /100 | #106 | Exceptional $90,761 |
| Croatians | 97.3 /100 | #107 | Exceptional $90,685 |
| Zimbabweans | 97.2 /100 | #108 | Exceptional $90,618 |
| Chileans | 97.2 /100 | #109 | Exceptional $90,605 |
| Palestinians | 97.1 /100 | #110 | Exceptional $90,574 |
| Immigrants | Poland | 97.1 /100 | #111 | Exceptional $90,549 |
| Northern Europeans | 96.9 /100 | #112 | Exceptional $90,446 |
| Peruvians | 96.5 /100 | #113 | Exceptional $90,261 |
| Immigrants | Northern Africa | 95.9 /100 | #114 | Exceptional $90,026 |
| Immigrants | Western Asia | 95.9 /100 | #115 | Exceptional $90,005 |
| Native Hawaiians | 95.7 /100 | #116 | Exceptional $89,919 |
| Taiwanese | 95.6 /100 | #117 | Exceptional $89,900 |
| Syrians | 95.4 /100 | #118 | Exceptional $89,830 |
Demographics Similar to Immigrants from Pakistan by Median Household Income
In terms of median household income, the demographic groups most similar to Immigrants from Pakistan are Latvian ($97,311, a difference of 0.22%), Immigrants from Indonesia ($97,297, a difference of 0.24%), Immigrants from Switzerland ($97,979, a difference of 0.46%), Russian ($98,008, a difference of 0.49%), and Afghan ($97,026, a difference of 0.52%).
| Demographics | Rating | Rank | Median Household Income |
| Immigrants | Asia | 100.0 /100 | #29 | Exceptional $99,933 |
| Immigrants | Northern Europe | 100.0 /100 | #30 | Exceptional $99,813 |
| Turks | 100.0 /100 | #31 | Exceptional $99,389 |
| Immigrants | Denmark | 100.0 /100 | #32 | Exceptional $98,510 |
| Chinese | 100.0 /100 | #33 | Exceptional $98,496 |
| Russians | 100.0 /100 | #34 | Exceptional $98,008 |
| Immigrants | Switzerland | 100.0 /100 | #35 | Exceptional $97,979 |
| Immigrants | Pakistan | 100.0 /100 | #36 | Exceptional $97,528 |
| Latvians | 100.0 /100 | #37 | Exceptional $97,311 |
| Immigrants | Indonesia | 100.0 /100 | #38 | Exceptional $97,297 |
| Afghans | 100.0 /100 | #39 | Exceptional $97,026 |
| Maltese | 100.0 /100 | #40 | Exceptional $97,015 |
| Immigrants | Turkey | 100.0 /100 | #41 | Exceptional $96,964 |
| Immigrants | Lithuania | 99.9 /100 | #42 | Exceptional $96,836 |
| Immigrants | France | 99.9 /100 | #43 | Exceptional $96,743 |