Panamanian vs French Canadian Single Male Poverty
COMPARE
Panamanian
French Canadian
Single Male Poverty
Single Male Poverty Comparison
Panamanians
French Canadians
12.9%
SINGLE MALE POVERTY
37.6/ 100
METRIC RATING
181st/ 347
METRIC RANK
14.6%
SINGLE MALE POVERTY
0.0/ 100
METRIC RATING
293rd/ 347
METRIC RANK
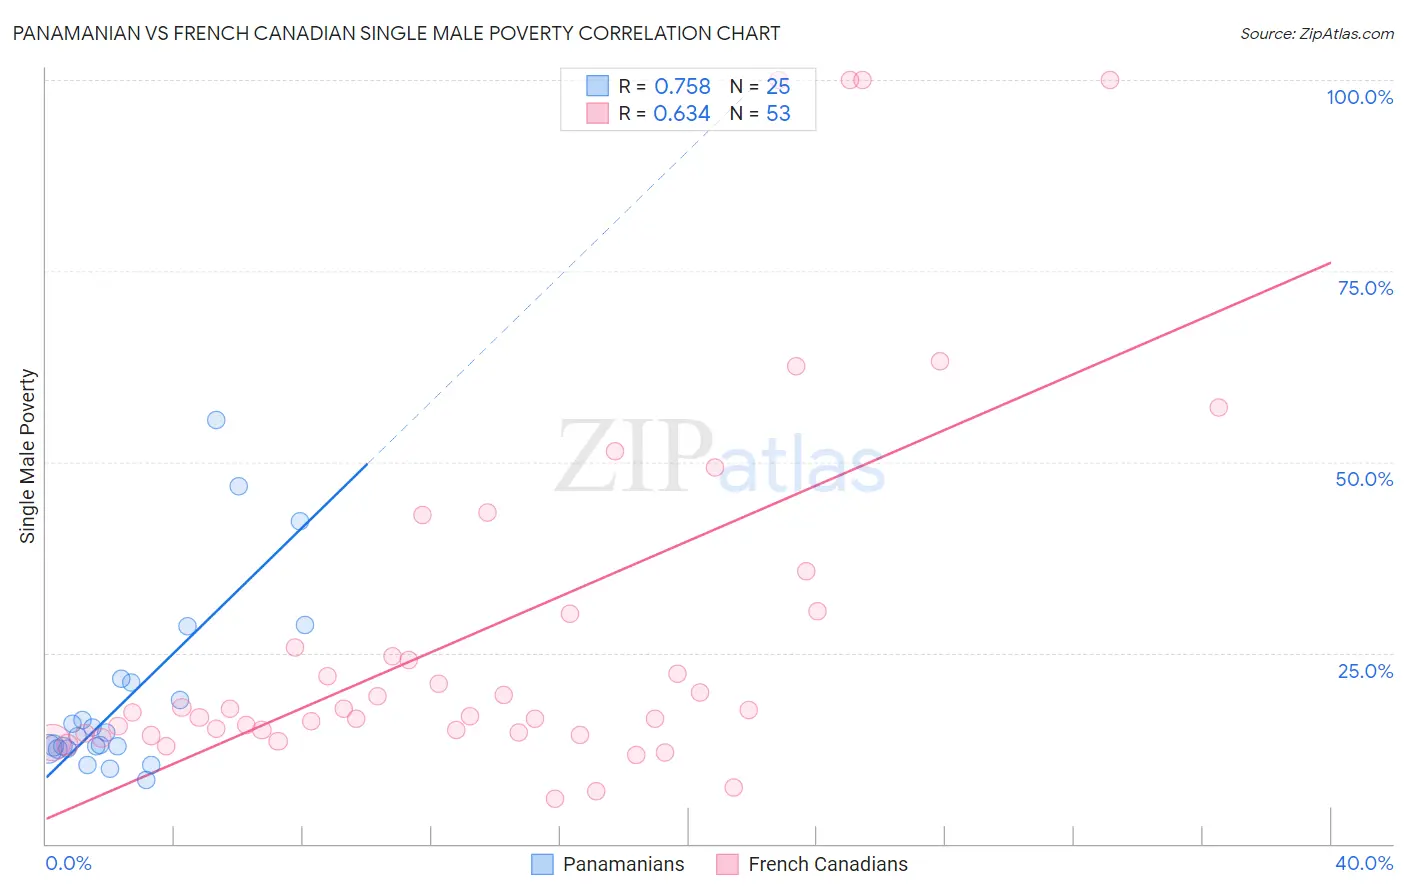
Panamanian vs French Canadian Single Male Poverty Correlation Chart
The statistical analysis conducted on geographies consisting of 259,773,019 people shows a strong positive correlation between the proportion of Panamanians and poverty level among single males in the United States with a correlation coefficient (R) of 0.758 and weighted average of 12.9%. Similarly, the statistical analysis conducted on geographies consisting of 426,083,724 people shows a significant positive correlation between the proportion of French Canadians and poverty level among single males in the United States with a correlation coefficient (R) of 0.634 and weighted average of 14.6%, a difference of 13.2%.
Single Male Poverty Correlation Summary
| Measurement | Panamanian | French Canadian |
| Minimum | 8.3% | 5.9% |
| Maximum | 55.6% | 100.0% |
| Range | 47.2% | 94.1% |
| Mean | 19.2% | 28.2% |
| Median | 14.1% | 17.5% |
| Interquartile 25% (IQ1) | 12.4% | 14.5% |
| Interquartile 75% (IQ3) | 21.4% | 30.3% |
| Interquartile Range (IQR) | 8.9% | 15.8% |
| Standard Deviation (Sample) | 12.2% | 24.7% |
| Standard Deviation (Population) | 12.0% | 24.5% |
Similar Demographics by Single Male Poverty
Demographics Similar to Panamanians by Single Male Poverty
In terms of single male poverty, the demographic groups most similar to Panamanians are Immigrants from North America (12.9%, a difference of 0.010%), Moroccan (12.9%, a difference of 0.040%), Israeli (12.9%, a difference of 0.19%), Immigrants from West Indies (12.9%, a difference of 0.26%), and Immigrants from Trinidad and Tobago (12.9%, a difference of 0.29%).
| Demographics | Rating | Rank | Single Male Poverty |
| Costa Ricans | 50.0 /100 | #174 | Average 12.8% |
| Croatians | 48.9 /100 | #175 | Average 12.8% |
| Syrians | 48.4 /100 | #176 | Average 12.8% |
| Immigrants | Canada | 44.8 /100 | #177 | Average 12.8% |
| Immigrants | Switzerland | 43.1 /100 | #178 | Average 12.8% |
| Israelis | 41.0 /100 | #179 | Average 12.9% |
| Immigrants | North America | 37.7 /100 | #180 | Fair 12.9% |
| Panamanians | 37.6 /100 | #181 | Fair 12.9% |
| Moroccans | 36.8 /100 | #182 | Fair 12.9% |
| Immigrants | West Indies | 33.0 /100 | #183 | Fair 12.9% |
| Immigrants | Trinidad and Tobago | 32.5 /100 | #184 | Fair 12.9% |
| Norwegians | 32.0 /100 | #185 | Fair 12.9% |
| Nigerians | 31.9 /100 | #186 | Fair 12.9% |
| Immigrants | Kuwait | 31.9 /100 | #187 | Fair 12.9% |
| Macedonians | 31.5 /100 | #188 | Fair 12.9% |
Demographics Similar to French Canadians by Single Male Poverty
In terms of single male poverty, the demographic groups most similar to French Canadians are Nonimmigrants (14.6%, a difference of 0.11%), Ottawa (14.6%, a difference of 0.19%), Bahamian (14.6%, a difference of 0.25%), U.S. Virgin Islander (14.5%, a difference of 0.40%), and Immigrants from Dominica (14.5%, a difference of 0.63%).
| Demographics | Rating | Rank | Single Male Poverty |
| Celtics | 0.0 /100 | #286 | Tragic 14.5% |
| Iroquois | 0.0 /100 | #287 | Tragic 14.5% |
| Whites/Caucasians | 0.0 /100 | #288 | Tragic 14.5% |
| Immigrants | Dominica | 0.0 /100 | #289 | Tragic 14.5% |
| U.S. Virgin Islanders | 0.0 /100 | #290 | Tragic 14.5% |
| Bahamians | 0.0 /100 | #291 | Tragic 14.6% |
| Immigrants | Nonimmigrants | 0.0 /100 | #292 | Tragic 14.6% |
| French Canadians | 0.0 /100 | #293 | Tragic 14.6% |
| Ottawa | 0.0 /100 | #294 | Tragic 14.6% |
| Scotch-Irish | 0.0 /100 | #295 | Tragic 14.7% |
| Africans | 0.0 /100 | #296 | Tragic 14.7% |
| Immigrants | Dominican Republic | 0.0 /100 | #297 | Tragic 14.8% |
| French American Indians | 0.0 /100 | #298 | Tragic 15.0% |
| Delaware | 0.0 /100 | #299 | Tragic 15.0% |
| Cree | 0.0 /100 | #300 | Tragic 15.1% |