Immigrants from Senegal vs Peruvian Per Capita Income
COMPARE
Immigrants from Senegal
Peruvian
Per Capita Income
Per Capita Income Comparison
Immigrants from Senegal
Peruvians
$41,830
PER CAPITA INCOME
11.3/ 100
METRIC RATING
212th/ 347
METRIC RANK
$44,479
PER CAPITA INCOME
71.5/ 100
METRIC RATING
152nd/ 347
METRIC RANK
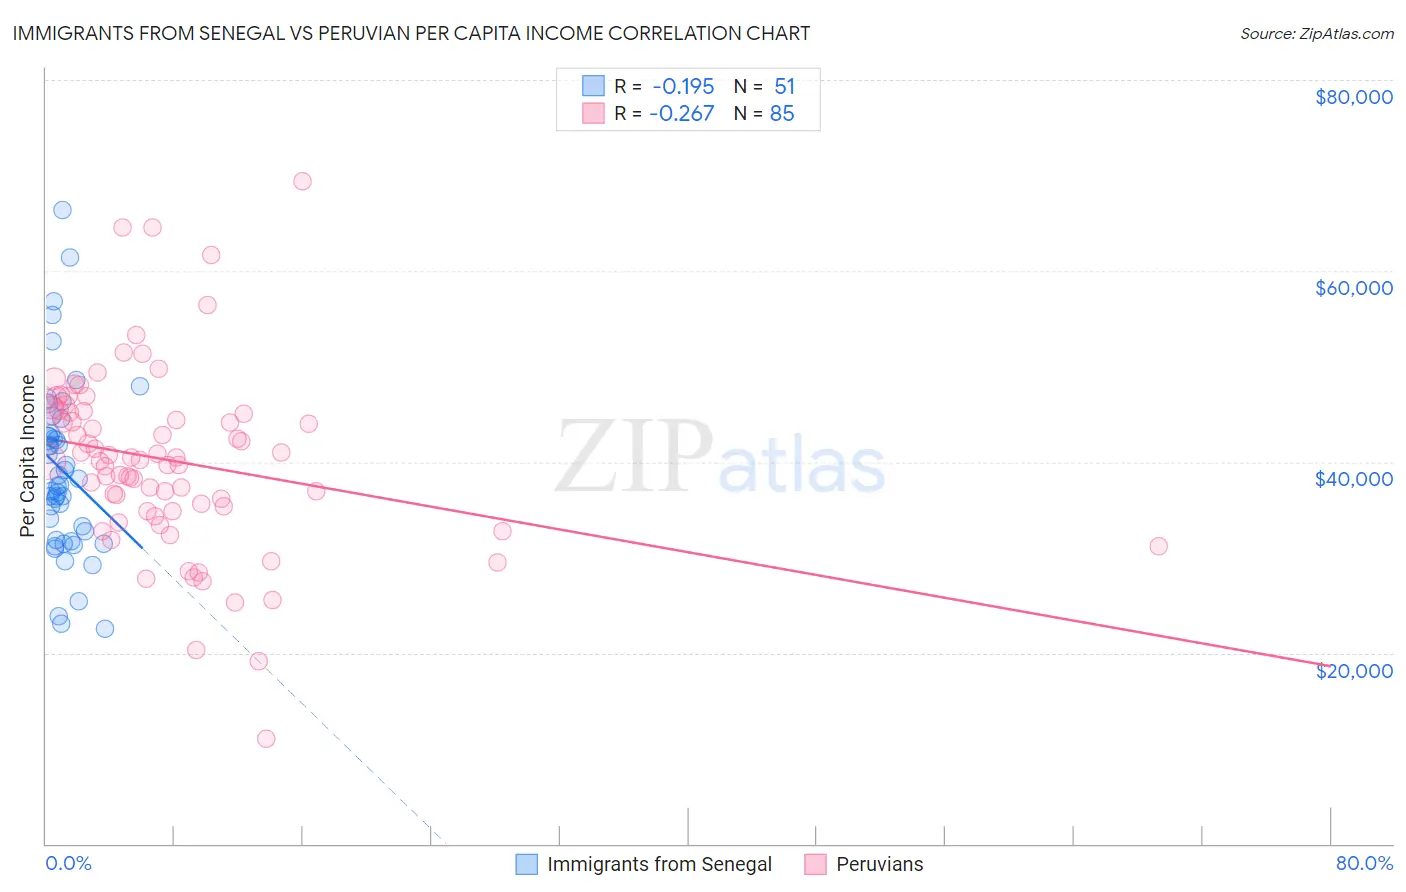
Immigrants from Senegal vs Peruvian Per Capita Income Correlation Chart
The statistical analysis conducted on geographies consisting of 90,129,295 people shows a poor negative correlation between the proportion of Immigrants from Senegal and per capita income in the United States with a correlation coefficient (R) of -0.195 and weighted average of $41,830. Similarly, the statistical analysis conducted on geographies consisting of 363,263,285 people shows a weak negative correlation between the proportion of Peruvians and per capita income in the United States with a correlation coefficient (R) of -0.267 and weighted average of $44,479, a difference of 6.3%.
Per Capita Income Correlation Summary
| Measurement | Immigrants from Senegal | Peruvian |
| Minimum | $22,459 | $11,041 |
| Maximum | $66,378 | $69,376 |
| Range | $43,919 | $58,335 |
| Mean | $39,027 | $40,176 |
| Median | $37,536 | $40,253 |
| Interquartile 25% (IQ1) | $31,835 | $34,775 |
| Interquartile 75% (IQ3) | $42,907 | $45,381 |
| Interquartile Range (IQR) | $11,072 | $10,606 |
| Standard Deviation (Sample) | $9,175 | $9,639 |
| Standard Deviation (Population) | $9,085 | $9,582 |
Similar Demographics by Per Capita Income
Demographics Similar to Immigrants from Senegal by Per Capita Income
In terms of per capita income, the demographic groups most similar to Immigrants from Senegal are Immigrants from Panama ($41,853, a difference of 0.050%), Immigrants from Venezuela ($41,727, a difference of 0.25%), Immigrants from Bangladesh ($41,709, a difference of 0.29%), Ecuadorian ($41,958, a difference of 0.30%), and Sudanese ($41,695, a difference of 0.32%).
| Demographics | Rating | Rank | Per Capita Income |
| Whites/Caucasians | 15.9 /100 | #205 | Poor $42,180 |
| Ghanaians | 15.7 /100 | #206 | Poor $42,164 |
| Venezuelans | 14.4 /100 | #207 | Poor $42,074 |
| Panamanians | 13.9 /100 | #208 | Poor $42,035 |
| Immigrants | Sudan | 13.2 /100 | #209 | Poor $41,986 |
| Ecuadorians | 12.9 /100 | #210 | Poor $41,958 |
| Immigrants | Panama | 11.6 /100 | #211 | Poor $41,853 |
| Immigrants | Senegal | 11.3 /100 | #212 | Poor $41,830 |
| Immigrants | Venezuela | 10.2 /100 | #213 | Poor $41,727 |
| Immigrants | Bangladesh | 10.1 /100 | #214 | Poor $41,709 |
| Sudanese | 9.9 /100 | #215 | Tragic $41,695 |
| Tongans | 9.9 /100 | #216 | Tragic $41,693 |
| Guamanians/Chamorros | 9.7 /100 | #217 | Tragic $41,678 |
| Trinidadians and Tobagonians | 9.5 /100 | #218 | Tragic $41,655 |
| Puget Sound Salish | 8.1 /100 | #219 | Tragic $41,495 |
Demographics Similar to Peruvians by Per Capita Income
In terms of per capita income, the demographic groups most similar to Peruvians are Norwegian ($44,480, a difference of 0.0%), Immigrants from Eritrea ($44,509, a difference of 0.070%), Scottish ($44,440, a difference of 0.090%), Korean ($44,522, a difference of 0.10%), and Immigrants from Armenia ($44,552, a difference of 0.17%).
| Demographics | Rating | Rank | Per Capita Income |
| Immigrants | Afghanistan | 78.0 /100 | #145 | Good $44,790 |
| Irish | 75.8 /100 | #146 | Good $44,679 |
| Czechs | 74.1 /100 | #147 | Good $44,595 |
| Immigrants | Armenia | 73.1 /100 | #148 | Good $44,552 |
| Koreans | 72.5 /100 | #149 | Good $44,522 |
| Immigrants | Eritrea | 72.1 /100 | #150 | Good $44,509 |
| Norwegians | 71.5 /100 | #151 | Good $44,480 |
| Peruvians | 71.5 /100 | #152 | Good $44,479 |
| Scottish | 70.6 /100 | #153 | Good $44,440 |
| Portuguese | 68.7 /100 | #154 | Good $44,362 |
| Uruguayans | 67.6 /100 | #155 | Good $44,318 |
| Slovaks | 65.4 /100 | #156 | Good $44,229 |
| South American Indians | 64.8 /100 | #157 | Good $44,206 |
| Immigrants | Nepal | 64.3 /100 | #158 | Good $44,187 |
| South Americans | 62.4 /100 | #159 | Good $44,114 |