Immigrants from Middle Africa vs Peruvian Per Capita Income
COMPARE
Immigrants from Middle Africa
Peruvian
Per Capita Income
Per Capita Income Comparison
Immigrants from Middle Africa
Peruvians
$39,529
PER CAPITA INCOME
1.0/ 100
METRIC RATING
255th/ 347
METRIC RANK
$44,479
PER CAPITA INCOME
71.5/ 100
METRIC RATING
152nd/ 347
METRIC RANK
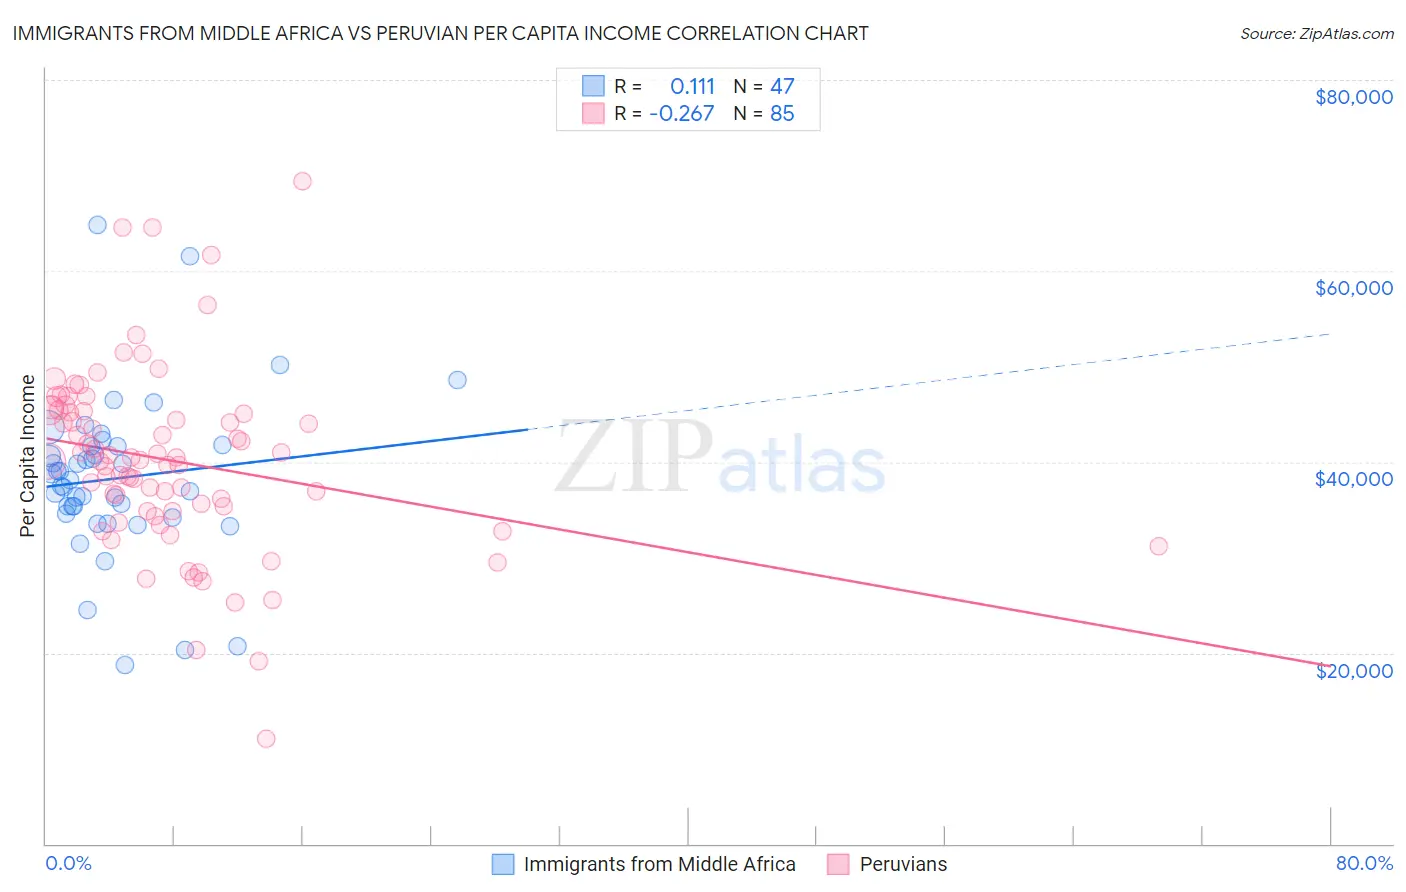
Immigrants from Middle Africa vs Peruvian Per Capita Income Correlation Chart
The statistical analysis conducted on geographies consisting of 202,748,114 people shows a poor positive correlation between the proportion of Immigrants from Middle Africa and per capita income in the United States with a correlation coefficient (R) of 0.111 and weighted average of $39,529. Similarly, the statistical analysis conducted on geographies consisting of 363,263,285 people shows a weak negative correlation between the proportion of Peruvians and per capita income in the United States with a correlation coefficient (R) of -0.267 and weighted average of $44,479, a difference of 12.5%.
Per Capita Income Correlation Summary
| Measurement | Immigrants from Middle Africa | Peruvian |
| Minimum | $18,741 | $11,041 |
| Maximum | $64,792 | $69,376 |
| Range | $46,051 | $58,335 |
| Mean | $38,268 | $40,176 |
| Median | $38,152 | $40,253 |
| Interquartile 25% (IQ1) | $34,623 | $34,775 |
| Interquartile 75% (IQ3) | $41,622 | $45,381 |
| Interquartile Range (IQR) | $6,999 | $10,606 |
| Standard Deviation (Sample) | $8,450 | $9,639 |
| Standard Deviation (Population) | $8,360 | $9,582 |
Similar Demographics by Per Capita Income
Demographics Similar to Immigrants from Middle Africa by Per Capita Income
In terms of per capita income, the demographic groups most similar to Immigrants from Middle Africa are Alaska Native ($39,558, a difference of 0.070%), Osage ($39,568, a difference of 0.10%), Immigrants from the Azores ($39,608, a difference of 0.20%), Hawaiian ($39,403, a difference of 0.32%), and Nicaraguan ($39,372, a difference of 0.40%).
| Demographics | Rating | Rank | Per Capita Income |
| Cape Verdeans | 1.5 /100 | #248 | Tragic $39,935 |
| Japanese | 1.4 /100 | #249 | Tragic $39,870 |
| Immigrants | Burma/Myanmar | 1.3 /100 | #250 | Tragic $39,827 |
| Samoans | 1.3 /100 | #251 | Tragic $39,826 |
| Immigrants | Azores | 1.0 /100 | #252 | Tragic $39,608 |
| Osage | 1.0 /100 | #253 | Tragic $39,568 |
| Alaska Natives | 1.0 /100 | #254 | Tragic $39,558 |
| Immigrants | Middle Africa | 1.0 /100 | #255 | Tragic $39,529 |
| Hawaiians | 0.8 /100 | #256 | Tragic $39,403 |
| Nicaraguans | 0.8 /100 | #257 | Tragic $39,372 |
| Jamaicans | 0.7 /100 | #258 | Tragic $39,231 |
| Malaysians | 0.7 /100 | #259 | Tragic $39,194 |
| Alaskan Athabascans | 0.6 /100 | #260 | Tragic $39,163 |
| Marshallese | 0.6 /100 | #261 | Tragic $39,108 |
| Iroquois | 0.6 /100 | #262 | Tragic $39,104 |
Demographics Similar to Peruvians by Per Capita Income
In terms of per capita income, the demographic groups most similar to Peruvians are Norwegian ($44,480, a difference of 0.0%), Immigrants from Eritrea ($44,509, a difference of 0.070%), Scottish ($44,440, a difference of 0.090%), Korean ($44,522, a difference of 0.10%), and Immigrants from Armenia ($44,552, a difference of 0.17%).
| Demographics | Rating | Rank | Per Capita Income |
| Immigrants | Afghanistan | 78.0 /100 | #145 | Good $44,790 |
| Irish | 75.8 /100 | #146 | Good $44,679 |
| Czechs | 74.1 /100 | #147 | Good $44,595 |
| Immigrants | Armenia | 73.1 /100 | #148 | Good $44,552 |
| Koreans | 72.5 /100 | #149 | Good $44,522 |
| Immigrants | Eritrea | 72.1 /100 | #150 | Good $44,509 |
| Norwegians | 71.5 /100 | #151 | Good $44,480 |
| Peruvians | 71.5 /100 | #152 | Good $44,479 |
| Scottish | 70.6 /100 | #153 | Good $44,440 |
| Portuguese | 68.7 /100 | #154 | Good $44,362 |
| Uruguayans | 67.6 /100 | #155 | Good $44,318 |
| Slovaks | 65.4 /100 | #156 | Good $44,229 |
| South American Indians | 64.8 /100 | #157 | Good $44,206 |
| Immigrants | Nepal | 64.3 /100 | #158 | Good $44,187 |
| South Americans | 62.4 /100 | #159 | Good $44,114 |