Palestinian vs Greek Householder Income Ages 25 - 44 years
COMPARE
Palestinian
Greek
Householder Income Ages 25 - 44 years
Householder Income Ages 25 - 44 years Comparison
Palestinians
Greeks
$98,777
HOUSEHOLDER INCOME AGES 25 - 44 YEARS
91.2/ 100
METRIC RATING
123rd/ 347
METRIC RANK
$106,457
HOUSEHOLDER INCOME AGES 25 - 44 YEARS
99.9/ 100
METRIC RATING
55th/ 347
METRIC RANK
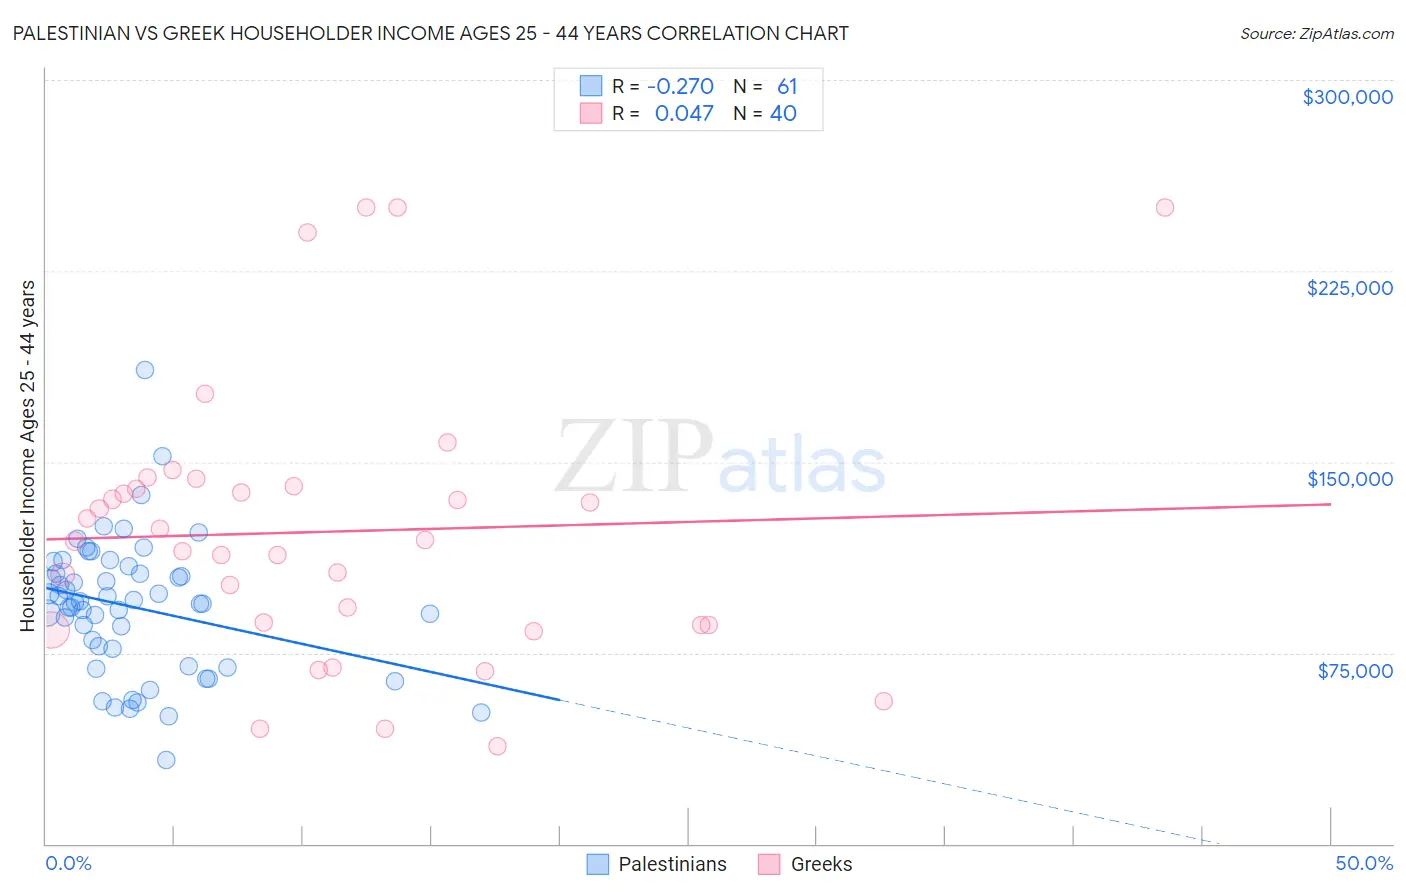
Palestinian vs Greek Householder Income Ages 25 - 44 years Correlation Chart
The statistical analysis conducted on geographies consisting of 216,290,532 people shows a weak negative correlation between the proportion of Palestinians and household income with householder between the ages 25 and 44 in the United States with a correlation coefficient (R) of -0.270 and weighted average of $98,777. Similarly, the statistical analysis conducted on geographies consisting of 480,636,486 people shows no correlation between the proportion of Greeks and household income with householder between the ages 25 and 44 in the United States with a correlation coefficient (R) of 0.047 and weighted average of $106,457, a difference of 7.8%.
Householder Income Ages 25 - 44 years Correlation Summary
| Measurement | Palestinian | Greek |
| Minimum | $33,077 | $38,250 |
| Maximum | $186,111 | $250,001 |
| Range | $153,034 | $211,751 |
| Mean | $93,023 | $122,593 |
| Median | $94,675 | $119,219 |
| Interquartile 25% (IQ1) | $73,167 | $85,764 |
| Interquartile 75% (IQ3) | $107,616 | $139,981 |
| Interquartile Range (IQR) | $34,449 | $54,217 |
| Standard Deviation (Sample) | $26,611 | $53,394 |
| Standard Deviation (Population) | $26,392 | $52,723 |
Similar Demographics by Householder Income Ages 25 - 44 years
Demographics Similar to Palestinians by Householder Income Ages 25 - 44 years
In terms of householder income ages 25 - 44 years, the demographic groups most similar to Palestinians are Immigrants from Uzbekistan ($98,849, a difference of 0.070%), Peruvian ($98,886, a difference of 0.11%), Zimbabwean ($98,586, a difference of 0.19%), Swedish ($99,136, a difference of 0.36%), and Pakistani ($98,401, a difference of 0.38%).
| Demographics | Rating | Rank | Householder Income Ages 25 - 44 years |
| Portuguese | 93.7 /100 | #116 | Exceptional $99,429 |
| Immigrants | Northern Africa | 93.0 /100 | #117 | Exceptional $99,232 |
| Syrians | 92.9 /100 | #118 | Exceptional $99,215 |
| Jordanians | 92.8 /100 | #119 | Exceptional $99,186 |
| Swedes | 92.7 /100 | #120 | Exceptional $99,136 |
| Peruvians | 91.7 /100 | #121 | Exceptional $98,886 |
| Immigrants | Uzbekistan | 91.5 /100 | #122 | Exceptional $98,849 |
| Palestinians | 91.2 /100 | #123 | Exceptional $98,777 |
| Zimbabweans | 90.3 /100 | #124 | Exceptional $98,586 |
| Pakistanis | 89.3 /100 | #125 | Excellent $98,401 |
| British | 89.1 /100 | #126 | Excellent $98,359 |
| Serbians | 88.9 /100 | #127 | Excellent $98,320 |
| Europeans | 88.9 /100 | #128 | Excellent $98,310 |
| Brazilians | 88.6 /100 | #129 | Excellent $98,267 |
| Immigrants | Kuwait | 87.8 /100 | #130 | Excellent $98,122 |
Demographics Similar to Greeks by Householder Income Ages 25 - 44 years
In terms of householder income ages 25 - 44 years, the demographic groups most similar to Greeks are Paraguayan ($106,615, a difference of 0.15%), Immigrants from Norway ($106,629, a difference of 0.16%), Immigrants from Pakistan ($106,129, a difference of 0.31%), Immigrants from Austria ($106,103, a difference of 0.33%), and Immigrants from Europe ($106,817, a difference of 0.34%).
| Demographics | Rating | Rank | Householder Income Ages 25 - 44 years |
| Bulgarians | 99.9 /100 | #48 | Exceptional $107,264 |
| Immigrants | Turkey | 99.9 /100 | #49 | Exceptional $107,258 |
| Cambodians | 99.9 /100 | #50 | Exceptional $107,148 |
| Immigrants | Czechoslovakia | 99.9 /100 | #51 | Exceptional $106,888 |
| Immigrants | Europe | 99.9 /100 | #52 | Exceptional $106,817 |
| Immigrants | Norway | 99.9 /100 | #53 | Exceptional $106,629 |
| Paraguayans | 99.9 /100 | #54 | Exceptional $106,615 |
| Greeks | 99.9 /100 | #55 | Exceptional $106,457 |
| Immigrants | Pakistan | 99.8 /100 | #56 | Exceptional $106,129 |
| Immigrants | Austria | 99.8 /100 | #57 | Exceptional $106,103 |
| Immigrants | South Africa | 99.8 /100 | #58 | Exceptional $105,748 |
| Immigrants | Latvia | 99.8 /100 | #59 | Exceptional $105,522 |
| Egyptians | 99.7 /100 | #60 | Exceptional $105,282 |
| Lithuanians | 99.7 /100 | #61 | Exceptional $105,223 |
| Immigrants | Italy | 99.7 /100 | #62 | Exceptional $105,201 |