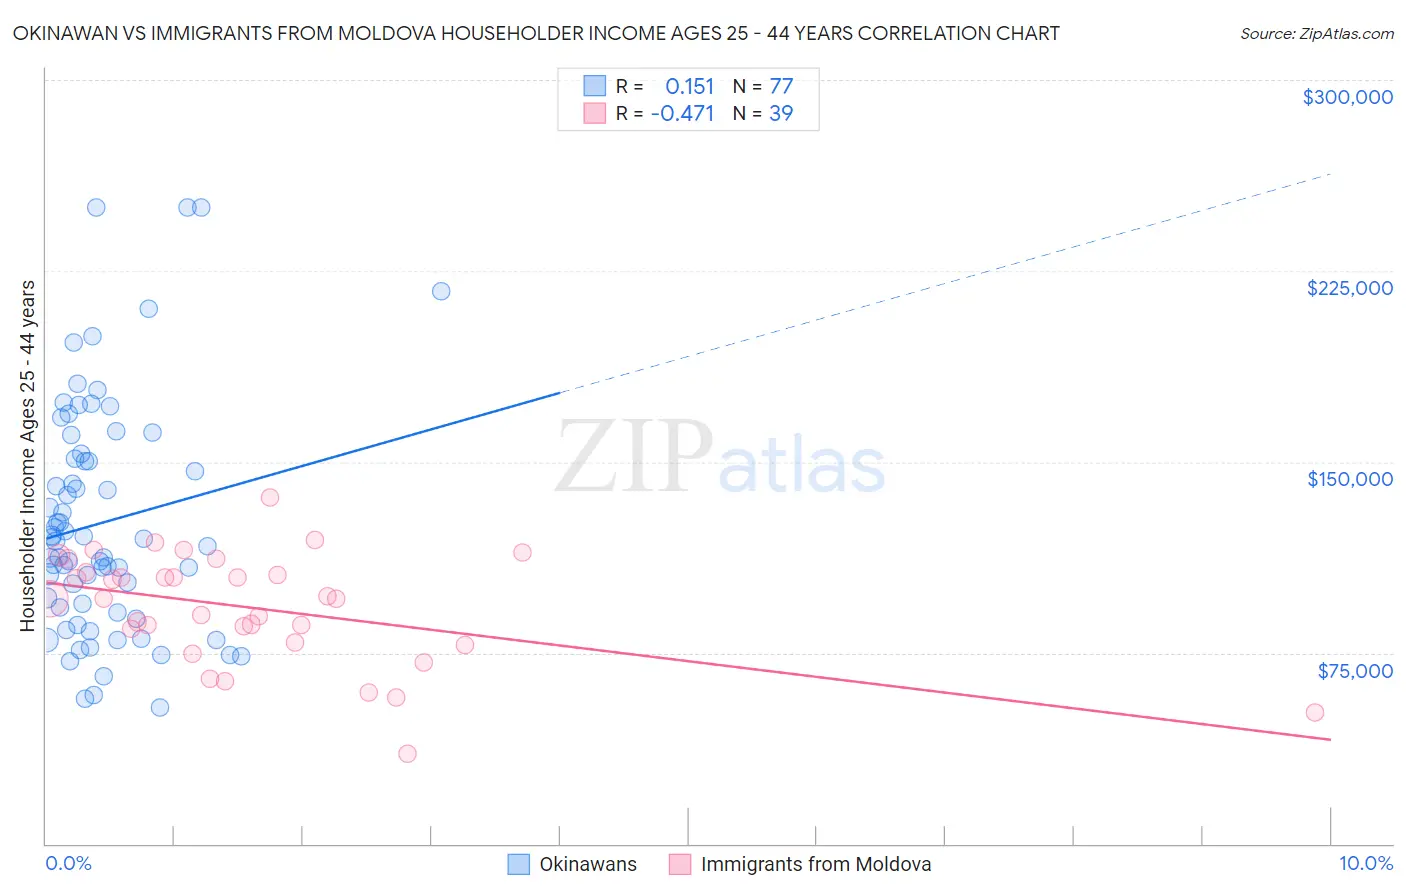
Okinawan vs Immigrants from Moldova Householder Income Ages 25 - 44 years
COMPARE
Okinawan
Immigrants from Moldova
Householder Income Ages 25 - 44 years
Householder Income Ages 25 - 44 years Comparison
Okinawans
Immigrants from Moldova
$119,349
HOUSEHOLDER INCOME AGES 25 - 44 YEARS
100.0/ 100
METRIC RATING
11th/ 347
METRIC RANK
$101,091
HOUSEHOLDER INCOME AGES 25 - 44 YEARS
97.4/ 100
METRIC RATING
103rd/ 347
METRIC RANK
Okinawan vs Immigrants from Moldova Householder Income Ages 25 - 44 years Correlation Chart
The statistical analysis conducted on geographies consisting of 73,689,702 people shows a poor positive correlation between the proportion of Okinawans and household income with householder between the ages 25 and 44 in the United States with a correlation coefficient (R) of 0.151 and weighted average of $119,349. Similarly, the statistical analysis conducted on geographies consisting of 124,290,289 people shows a moderate negative correlation between the proportion of Immigrants from Moldova and household income with householder between the ages 25 and 44 in the United States with a correlation coefficient (R) of -0.471 and weighted average of $101,091, a difference of 18.1%.
Householder Income Ages 25 - 44 years Correlation Summary
| Measurement | Okinawan | Immigrants from Moldova |
| Minimum | $53,516 | $35,313 |
| Maximum | $250,001 | $136,071 |
| Range | $196,485 | $100,758 |
| Mean | $126,213 | $92,583 |
| Median | $118,882 | $96,188 |
| Interquartile 25% (IQ1) | $91,836 | $79,269 |
| Interquartile 75% (IQ3) | $152,291 | $106,700 |
| Interquartile Range (IQR) | $60,455 | $27,431 |
| Standard Deviation (Sample) | $45,314 | $21,518 |
| Standard Deviation (Population) | $45,019 | $21,240 |
Similar Demographics by Householder Income Ages 25 - 44 years
Demographics Similar to Okinawans by Householder Income Ages 25 - 44 years
In terms of householder income ages 25 - 44 years, the demographic groups most similar to Okinawans are Indian (Asian) ($119,496, a difference of 0.12%), Immigrants from Iran ($119,204, a difference of 0.12%), Immigrants from China ($119,756, a difference of 0.34%), Iranian ($120,292, a difference of 0.79%), and Immigrants from Ireland ($120,333, a difference of 0.82%).
| Demographics | Rating | Rank | Householder Income Ages 25 - 44 years |
| Immigrants | Singapore | 100.0 /100 | #4 | Exceptional $124,429 |
| Immigrants | India | 100.0 /100 | #5 | Exceptional $124,238 |
| Thais | 100.0 /100 | #6 | Exceptional $121,778 |
| Immigrants | Ireland | 100.0 /100 | #7 | Exceptional $120,333 |
| Iranians | 100.0 /100 | #8 | Exceptional $120,292 |
| Immigrants | China | 100.0 /100 | #9 | Exceptional $119,756 |
| Indians (Asian) | 100.0 /100 | #10 | Exceptional $119,496 |
| Okinawans | 100.0 /100 | #11 | Exceptional $119,349 |
| Immigrants | Iran | 100.0 /100 | #12 | Exceptional $119,204 |
| Immigrants | Eastern Asia | 100.0 /100 | #13 | Exceptional $118,056 |
| Immigrants | Israel | 100.0 /100 | #14 | Exceptional $117,219 |
| Immigrants | South Central Asia | 100.0 /100 | #15 | Exceptional $116,626 |
| Cypriots | 100.0 /100 | #16 | Exceptional $116,364 |
| Immigrants | Australia | 100.0 /100 | #17 | Exceptional $115,947 |
| Eastern Europeans | 100.0 /100 | #18 | Exceptional $114,523 |
Demographics Similar to Immigrants from Moldova by Householder Income Ages 25 - 44 years
In terms of householder income ages 25 - 44 years, the demographic groups most similar to Immigrants from Moldova are Immigrants from Lebanon ($101,124, a difference of 0.030%), Immigrants from Poland ($101,065, a difference of 0.030%), Albanian ($101,367, a difference of 0.27%), Immigrants from Argentina ($101,415, a difference of 0.32%), and Taiwanese ($101,492, a difference of 0.40%).
| Demographics | Rating | Rank | Householder Income Ages 25 - 44 years |
| Macedonians | 98.3 /100 | #96 | Exceptional $101,882 |
| Austrians | 98.3 /100 | #97 | Exceptional $101,842 |
| Immigrants | Kazakhstan | 98.1 /100 | #98 | Exceptional $101,727 |
| Taiwanese | 97.9 /100 | #99 | Exceptional $101,492 |
| Immigrants | Argentina | 97.8 /100 | #100 | Exceptional $101,415 |
| Albanians | 97.8 /100 | #101 | Exceptional $101,367 |
| Immigrants | Lebanon | 97.4 /100 | #102 | Exceptional $101,124 |
| Immigrants | Moldova | 97.4 /100 | #103 | Exceptional $101,091 |
| Immigrants | Poland | 97.4 /100 | #104 | Exceptional $101,065 |
| Immigrants | Vietnam | 96.5 /100 | #105 | Exceptional $100,535 |
| Immigrants | Brazil | 96.5 /100 | #106 | Exceptional $100,534 |
| Northern Europeans | 96.3 /100 | #107 | Exceptional $100,457 |
| Immigrants | South Eastern Asia | 96.0 /100 | #108 | Exceptional $100,283 |
| Immigrants | North Macedonia | 95.6 /100 | #109 | Exceptional $100,101 |
| Immigrants | Afghanistan | 95.3 /100 | #110 | Exceptional $99,977 |