Palestinian vs Cheyenne Householder Income Ages 25 - 44 years
COMPARE
Palestinian
Cheyenne
Householder Income Ages 25 - 44 years
Householder Income Ages 25 - 44 years Comparison
Palestinians
Cheyenne
$98,777
HOUSEHOLDER INCOME AGES 25 - 44 YEARS
91.2/ 100
METRIC RATING
123rd/ 347
METRIC RANK
$79,152
HOUSEHOLDER INCOME AGES 25 - 44 YEARS
0.0/ 100
METRIC RATING
314th/ 347
METRIC RANK
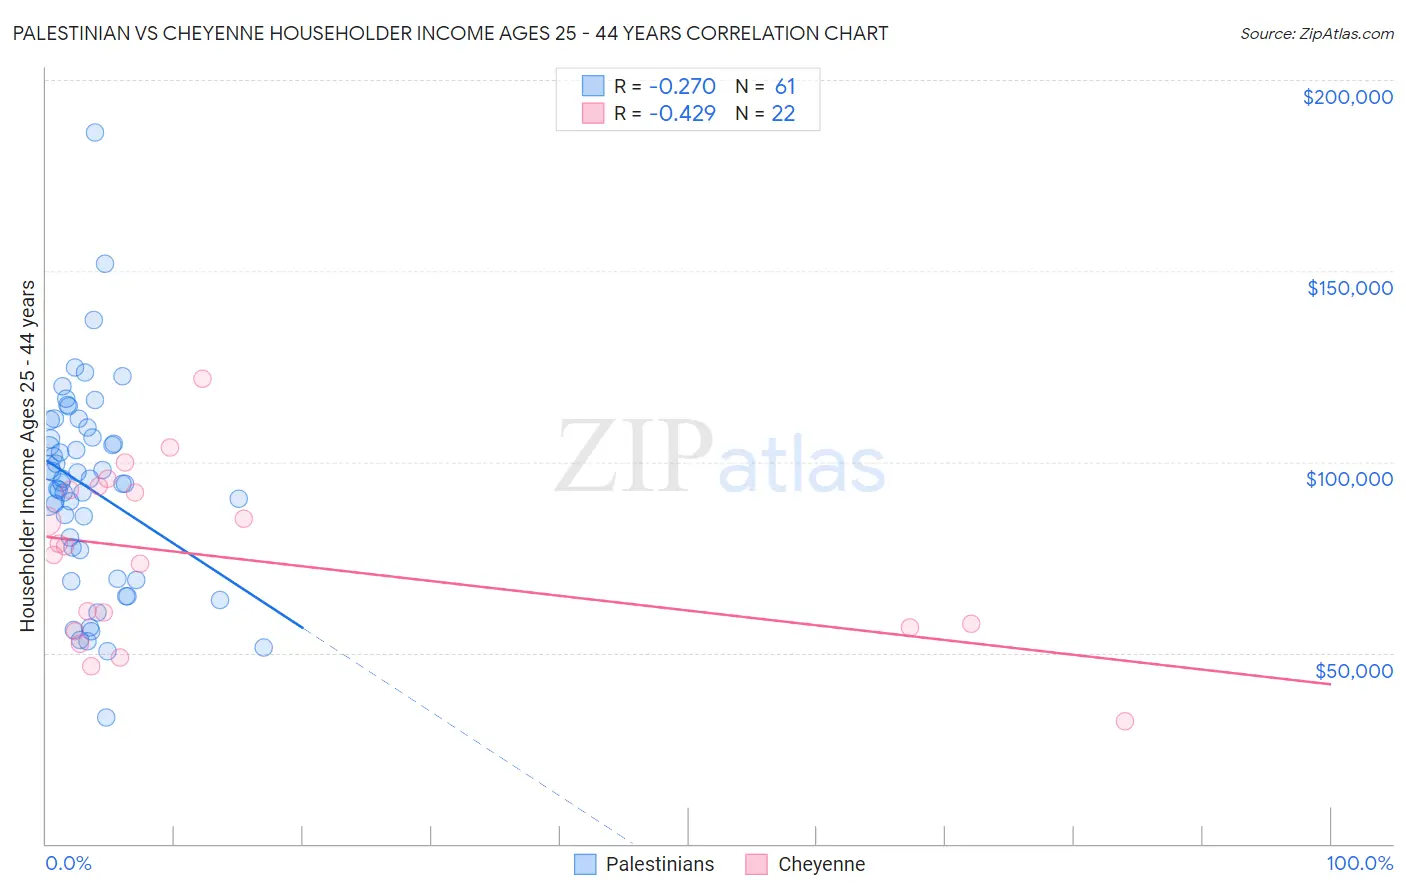
Palestinian vs Cheyenne Householder Income Ages 25 - 44 years Correlation Chart
The statistical analysis conducted on geographies consisting of 216,290,532 people shows a weak negative correlation between the proportion of Palestinians and household income with householder between the ages 25 and 44 in the United States with a correlation coefficient (R) of -0.270 and weighted average of $98,777. Similarly, the statistical analysis conducted on geographies consisting of 80,627,434 people shows a moderate negative correlation between the proportion of Cheyenne and household income with householder between the ages 25 and 44 in the United States with a correlation coefficient (R) of -0.429 and weighted average of $79,152, a difference of 24.8%.
Householder Income Ages 25 - 44 years Correlation Summary
| Measurement | Palestinian | Cheyenne |
| Minimum | $33,077 | $32,083 |
| Maximum | $186,111 | $121,699 |
| Range | $153,034 | $89,616 |
| Mean | $93,023 | $74,807 |
| Median | $94,675 | $76,769 |
| Interquartile 25% (IQ1) | $73,167 | $56,719 |
| Interquartile 75% (IQ3) | $107,616 | $92,585 |
| Interquartile Range (IQR) | $34,449 | $35,866 |
| Standard Deviation (Sample) | $26,611 | $22,346 |
| Standard Deviation (Population) | $26,392 | $21,832 |
Similar Demographics by Householder Income Ages 25 - 44 years
Demographics Similar to Palestinians by Householder Income Ages 25 - 44 years
In terms of householder income ages 25 - 44 years, the demographic groups most similar to Palestinians are Immigrants from Uzbekistan ($98,849, a difference of 0.070%), Peruvian ($98,886, a difference of 0.11%), Zimbabwean ($98,586, a difference of 0.19%), Swedish ($99,136, a difference of 0.36%), and Pakistani ($98,401, a difference of 0.38%).
| Demographics | Rating | Rank | Householder Income Ages 25 - 44 years |
| Portuguese | 93.7 /100 | #116 | Exceptional $99,429 |
| Immigrants | Northern Africa | 93.0 /100 | #117 | Exceptional $99,232 |
| Syrians | 92.9 /100 | #118 | Exceptional $99,215 |
| Jordanians | 92.8 /100 | #119 | Exceptional $99,186 |
| Swedes | 92.7 /100 | #120 | Exceptional $99,136 |
| Peruvians | 91.7 /100 | #121 | Exceptional $98,886 |
| Immigrants | Uzbekistan | 91.5 /100 | #122 | Exceptional $98,849 |
| Palestinians | 91.2 /100 | #123 | Exceptional $98,777 |
| Zimbabweans | 90.3 /100 | #124 | Exceptional $98,586 |
| Pakistanis | 89.3 /100 | #125 | Excellent $98,401 |
| British | 89.1 /100 | #126 | Excellent $98,359 |
| Serbians | 88.9 /100 | #127 | Excellent $98,320 |
| Europeans | 88.9 /100 | #128 | Excellent $98,310 |
| Brazilians | 88.6 /100 | #129 | Excellent $98,267 |
| Immigrants | Kuwait | 87.8 /100 | #130 | Excellent $98,122 |
Demographics Similar to Cheyenne by Householder Income Ages 25 - 44 years
In terms of householder income ages 25 - 44 years, the demographic groups most similar to Cheyenne are Ottawa ($79,012, a difference of 0.18%), African ($78,986, a difference of 0.21%), Menominee ($79,358, a difference of 0.26%), Immigrants from Haiti ($79,391, a difference of 0.30%), and U.S. Virgin Islander ($78,911, a difference of 0.30%).
| Demographics | Rating | Rank | Householder Income Ages 25 - 44 years |
| Haitians | 0.0 /100 | #307 | Tragic $80,055 |
| Immigrants | Central America | 0.0 /100 | #308 | Tragic $80,012 |
| Chippewa | 0.0 /100 | #309 | Tragic $80,005 |
| Fijians | 0.0 /100 | #310 | Tragic $79,956 |
| Indonesians | 0.0 /100 | #311 | Tragic $79,543 |
| Immigrants | Haiti | 0.0 /100 | #312 | Tragic $79,391 |
| Menominee | 0.0 /100 | #313 | Tragic $79,358 |
| Cheyenne | 0.0 /100 | #314 | Tragic $79,152 |
| Ottawa | 0.0 /100 | #315 | Tragic $79,012 |
| Africans | 0.0 /100 | #316 | Tragic $78,986 |
| U.S. Virgin Islanders | 0.0 /100 | #317 | Tragic $78,911 |
| Immigrants | Mexico | 0.0 /100 | #318 | Tragic $78,809 |
| Hondurans | 0.0 /100 | #319 | Tragic $78,540 |
| Choctaw | 0.0 /100 | #320 | Tragic $78,168 |
| Immigrants | Zaire | 0.0 /100 | #321 | Tragic $78,045 |