South American vs Immigrants from Moldova Householder Income Ages 25 - 44 years
COMPARE
South American
Immigrants from Moldova
Householder Income Ages 25 - 44 years
Householder Income Ages 25 - 44 years Comparison
South Americans
Immigrants from Moldova
$95,362
HOUSEHOLDER INCOME AGES 25 - 44 YEARS
60.9/ 100
METRIC RATING
164th/ 347
METRIC RANK
$101,091
HOUSEHOLDER INCOME AGES 25 - 44 YEARS
97.4/ 100
METRIC RATING
103rd/ 347
METRIC RANK
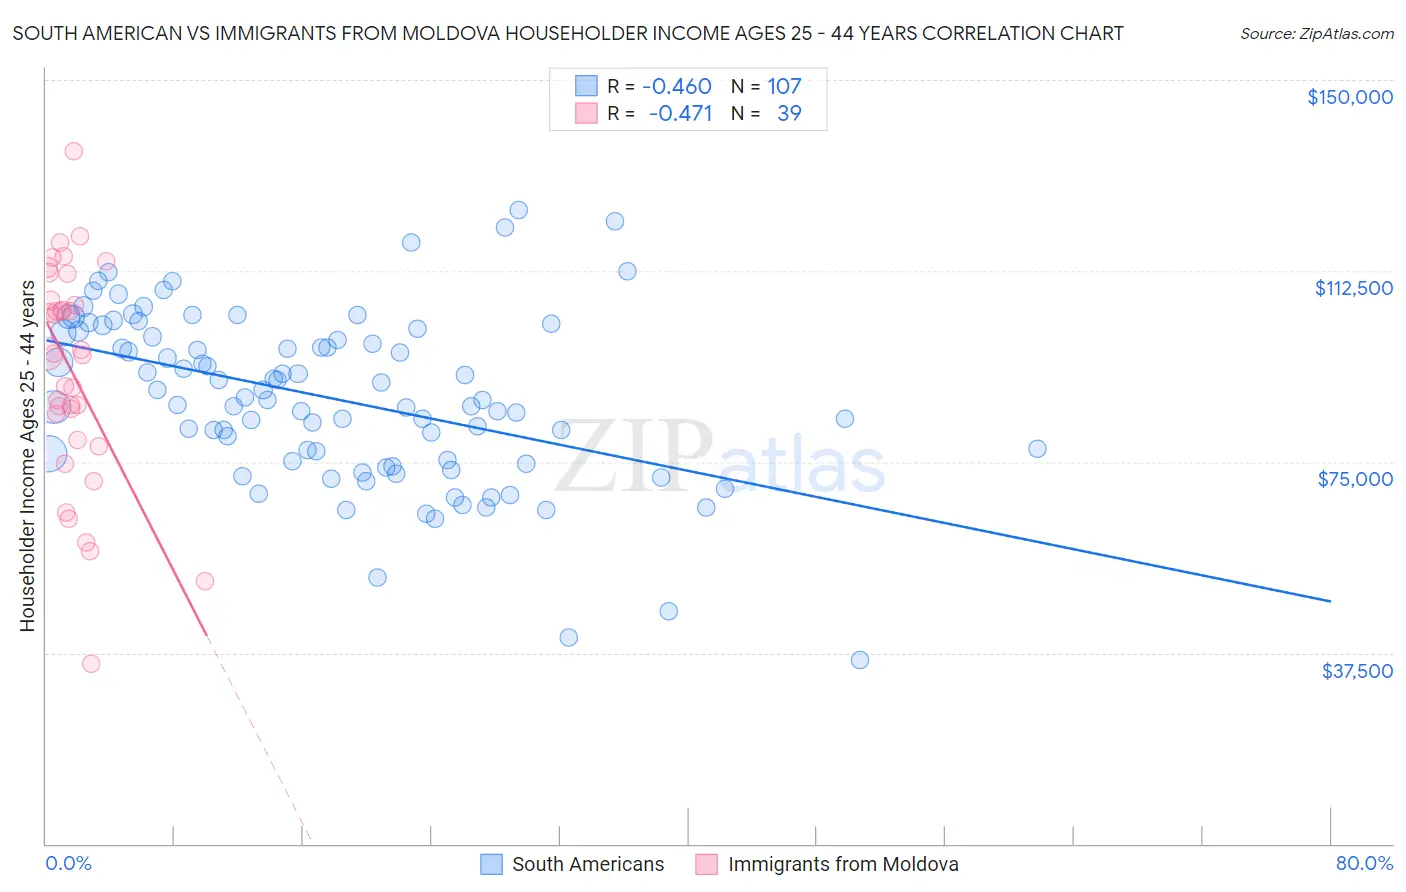
South American vs Immigrants from Moldova Householder Income Ages 25 - 44 years Correlation Chart
The statistical analysis conducted on geographies consisting of 492,106,064 people shows a moderate negative correlation between the proportion of South Americans and household income with householder between the ages 25 and 44 in the United States with a correlation coefficient (R) of -0.460 and weighted average of $95,362. Similarly, the statistical analysis conducted on geographies consisting of 124,290,289 people shows a moderate negative correlation between the proportion of Immigrants from Moldova and household income with householder between the ages 25 and 44 in the United States with a correlation coefficient (R) of -0.471 and weighted average of $101,091, a difference of 6.0%.
Householder Income Ages 25 - 44 years Correlation Summary
| Measurement | South American | Immigrants from Moldova |
| Minimum | $36,176 | $35,313 |
| Maximum | $124,375 | $136,071 |
| Range | $88,199 | $100,758 |
| Mean | $87,458 | $92,583 |
| Median | $87,265 | $96,188 |
| Interquartile 25% (IQ1) | $75,189 | $79,269 |
| Interquartile 75% (IQ3) | $100,291 | $106,700 |
| Interquartile Range (IQR) | $25,102 | $27,431 |
| Standard Deviation (Sample) | $16,777 | $21,518 |
| Standard Deviation (Population) | $16,698 | $21,240 |
Similar Demographics by Householder Income Ages 25 - 44 years
Demographics Similar to South Americans by Householder Income Ages 25 - 44 years
In terms of householder income ages 25 - 44 years, the demographic groups most similar to South Americans are Immigrants from Nepal ($95,322, a difference of 0.040%), Immigrants from Saudi Arabia ($95,450, a difference of 0.090%), Immigrants from Ethiopia ($95,256, a difference of 0.11%), Immigrants from Portugal ($95,512, a difference of 0.16%), and Swiss ($95,511, a difference of 0.16%).
| Demographics | Rating | Rank | Householder Income Ages 25 - 44 years |
| Immigrants | Uganda | 65.2 /100 | #157 | Good $95,698 |
| Scandinavians | 63.9 /100 | #158 | Good $95,596 |
| Costa Ricans | 63.5 /100 | #159 | Good $95,565 |
| Icelanders | 63.4 /100 | #160 | Good $95,560 |
| Immigrants | Portugal | 62.8 /100 | #161 | Good $95,512 |
| Swiss | 62.8 /100 | #162 | Good $95,511 |
| Immigrants | Saudi Arabia | 62.0 /100 | #163 | Good $95,450 |
| South Americans | 60.9 /100 | #164 | Good $95,362 |
| Immigrants | Nepal | 60.3 /100 | #165 | Good $95,322 |
| Immigrants | Ethiopia | 59.5 /100 | #166 | Average $95,256 |
| Czechoslovakians | 57.0 /100 | #167 | Average $95,070 |
| Alsatians | 56.8 /100 | #168 | Average $95,059 |
| Native Hawaiians | 56.8 /100 | #169 | Average $95,058 |
| Slovaks | 56.4 /100 | #170 | Average $95,032 |
| Immigrants | Armenia | 54.2 /100 | #171 | Average $94,867 |
Demographics Similar to Immigrants from Moldova by Householder Income Ages 25 - 44 years
In terms of householder income ages 25 - 44 years, the demographic groups most similar to Immigrants from Moldova are Immigrants from Lebanon ($101,124, a difference of 0.030%), Immigrants from Poland ($101,065, a difference of 0.030%), Albanian ($101,367, a difference of 0.27%), Immigrants from Argentina ($101,415, a difference of 0.32%), and Taiwanese ($101,492, a difference of 0.40%).
| Demographics | Rating | Rank | Householder Income Ages 25 - 44 years |
| Macedonians | 98.3 /100 | #96 | Exceptional $101,882 |
| Austrians | 98.3 /100 | #97 | Exceptional $101,842 |
| Immigrants | Kazakhstan | 98.1 /100 | #98 | Exceptional $101,727 |
| Taiwanese | 97.9 /100 | #99 | Exceptional $101,492 |
| Immigrants | Argentina | 97.8 /100 | #100 | Exceptional $101,415 |
| Albanians | 97.8 /100 | #101 | Exceptional $101,367 |
| Immigrants | Lebanon | 97.4 /100 | #102 | Exceptional $101,124 |
| Immigrants | Moldova | 97.4 /100 | #103 | Exceptional $101,091 |
| Immigrants | Poland | 97.4 /100 | #104 | Exceptional $101,065 |
| Immigrants | Vietnam | 96.5 /100 | #105 | Exceptional $100,535 |
| Immigrants | Brazil | 96.5 /100 | #106 | Exceptional $100,534 |
| Northern Europeans | 96.3 /100 | #107 | Exceptional $100,457 |
| Immigrants | South Eastern Asia | 96.0 /100 | #108 | Exceptional $100,283 |
| Immigrants | North Macedonia | 95.6 /100 | #109 | Exceptional $100,101 |
| Immigrants | Afghanistan | 95.3 /100 | #110 | Exceptional $99,977 |