Hawaiian vs Immigrants from Moldova Householder Income Ages 25 - 44 years
COMPARE
Hawaiian
Immigrants from Moldova
Householder Income Ages 25 - 44 years
Householder Income Ages 25 - 44 years Comparison
Hawaiians
Immigrants from Moldova
$90,722
HOUSEHOLDER INCOME AGES 25 - 44 YEARS
10.6/ 100
METRIC RATING
212th/ 347
METRIC RANK
$101,091
HOUSEHOLDER INCOME AGES 25 - 44 YEARS
97.4/ 100
METRIC RATING
103rd/ 347
METRIC RANK
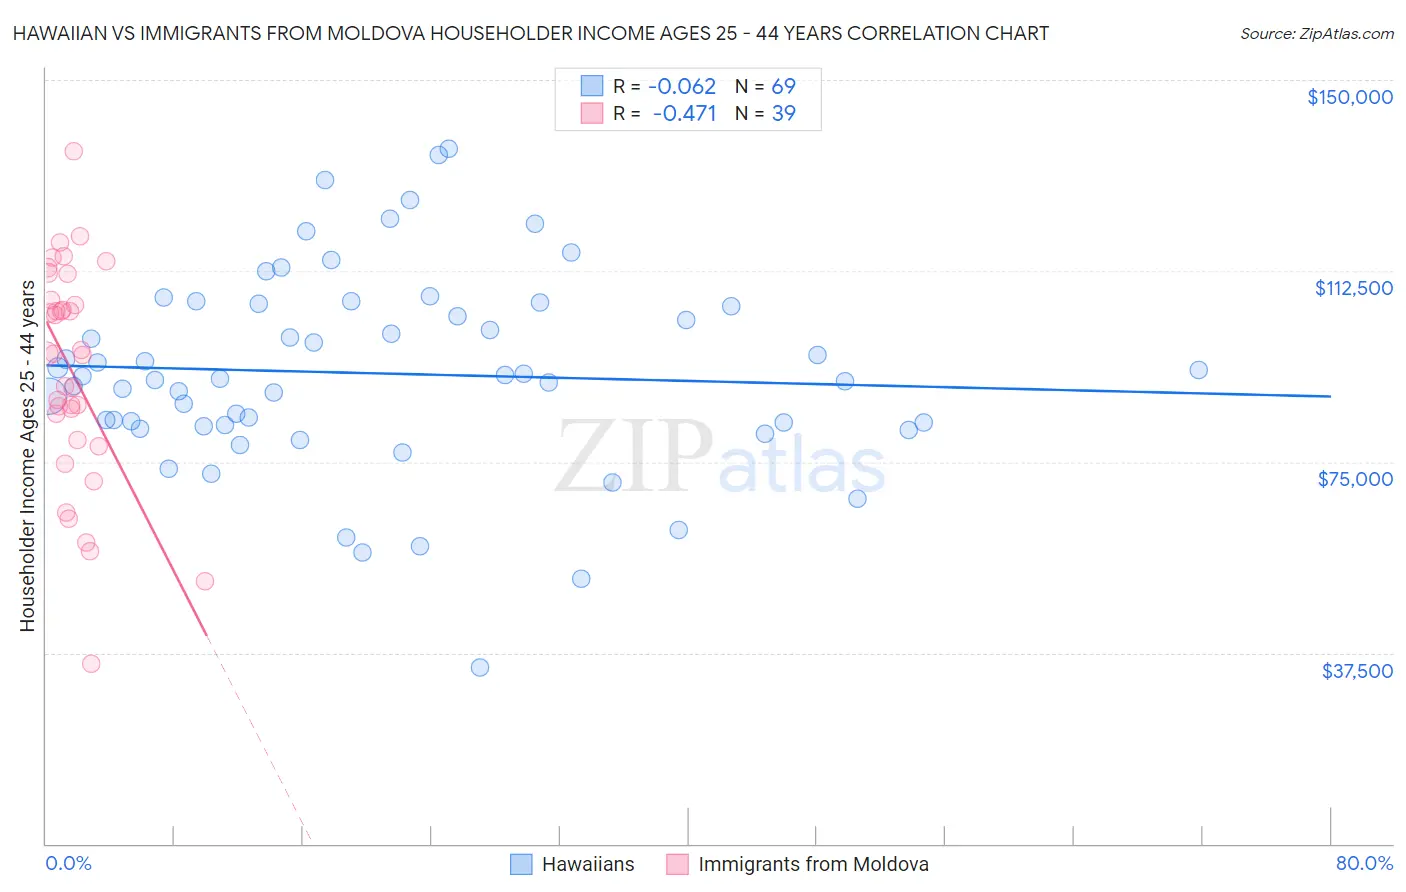
Hawaiian vs Immigrants from Moldova Householder Income Ages 25 - 44 years Correlation Chart
The statistical analysis conducted on geographies consisting of 326,791,638 people shows a slight negative correlation between the proportion of Hawaiians and household income with householder between the ages 25 and 44 in the United States with a correlation coefficient (R) of -0.062 and weighted average of $90,722. Similarly, the statistical analysis conducted on geographies consisting of 124,290,289 people shows a moderate negative correlation between the proportion of Immigrants from Moldova and household income with householder between the ages 25 and 44 in the United States with a correlation coefficient (R) of -0.471 and weighted average of $101,091, a difference of 11.4%.
Householder Income Ages 25 - 44 years Correlation Summary
| Measurement | Hawaiian | Immigrants from Moldova |
| Minimum | $34,643 | $35,313 |
| Maximum | $136,607 | $136,071 |
| Range | $101,964 | $100,758 |
| Mean | $92,360 | $92,583 |
| Median | $91,260 | $96,188 |
| Interquartile 25% (IQ1) | $82,156 | $79,269 |
| Interquartile 75% (IQ3) | $105,819 | $106,700 |
| Interquartile Range (IQR) | $23,663 | $27,431 |
| Standard Deviation (Sample) | $19,487 | $21,518 |
| Standard Deviation (Population) | $19,345 | $21,240 |
Similar Demographics by Householder Income Ages 25 - 44 years
Demographics Similar to Hawaiians by Householder Income Ages 25 - 44 years
In terms of householder income ages 25 - 44 years, the demographic groups most similar to Hawaiians are Immigrants from Kenya ($90,767, a difference of 0.050%), Iraqi ($90,764, a difference of 0.050%), Immigrants from Bangladesh ($90,448, a difference of 0.30%), Immigrants from Africa ($90,372, a difference of 0.39%), and Immigrants from Uruguay ($91,171, a difference of 0.49%).
| Demographics | Rating | Rank | Householder Income Ages 25 - 44 years |
| Immigrants | Eastern Africa | 15.2 /100 | #205 | Poor $91,458 |
| Aleuts | 14.5 /100 | #206 | Poor $91,370 |
| Yugoslavians | 14.5 /100 | #207 | Poor $91,368 |
| Immigrants | Thailand | 14.3 /100 | #208 | Poor $91,337 |
| Immigrants | Uruguay | 13.2 /100 | #209 | Poor $91,171 |
| Immigrants | Kenya | 10.9 /100 | #210 | Poor $90,767 |
| Iraqis | 10.8 /100 | #211 | Poor $90,764 |
| Hawaiians | 10.6 /100 | #212 | Poor $90,722 |
| Immigrants | Bangladesh | 9.3 /100 | #213 | Tragic $90,448 |
| Immigrants | Africa | 8.9 /100 | #214 | Tragic $90,372 |
| Panamanians | 8.1 /100 | #215 | Tragic $90,193 |
| Ghanaians | 7.9 /100 | #216 | Tragic $90,137 |
| Scotch-Irish | 7.3 /100 | #217 | Tragic $89,969 |
| Guyanese | 7.1 /100 | #218 | Tragic $89,940 |
| Delaware | 6.9 /100 | #219 | Tragic $89,876 |
Demographics Similar to Immigrants from Moldova by Householder Income Ages 25 - 44 years
In terms of householder income ages 25 - 44 years, the demographic groups most similar to Immigrants from Moldova are Immigrants from Lebanon ($101,124, a difference of 0.030%), Immigrants from Poland ($101,065, a difference of 0.030%), Albanian ($101,367, a difference of 0.27%), Immigrants from Argentina ($101,415, a difference of 0.32%), and Taiwanese ($101,492, a difference of 0.40%).
| Demographics | Rating | Rank | Householder Income Ages 25 - 44 years |
| Macedonians | 98.3 /100 | #96 | Exceptional $101,882 |
| Austrians | 98.3 /100 | #97 | Exceptional $101,842 |
| Immigrants | Kazakhstan | 98.1 /100 | #98 | Exceptional $101,727 |
| Taiwanese | 97.9 /100 | #99 | Exceptional $101,492 |
| Immigrants | Argentina | 97.8 /100 | #100 | Exceptional $101,415 |
| Albanians | 97.8 /100 | #101 | Exceptional $101,367 |
| Immigrants | Lebanon | 97.4 /100 | #102 | Exceptional $101,124 |
| Immigrants | Moldova | 97.4 /100 | #103 | Exceptional $101,091 |
| Immigrants | Poland | 97.4 /100 | #104 | Exceptional $101,065 |
| Immigrants | Vietnam | 96.5 /100 | #105 | Exceptional $100,535 |
| Immigrants | Brazil | 96.5 /100 | #106 | Exceptional $100,534 |
| Northern Europeans | 96.3 /100 | #107 | Exceptional $100,457 |
| Immigrants | South Eastern Asia | 96.0 /100 | #108 | Exceptional $100,283 |
| Immigrants | North Macedonia | 95.6 /100 | #109 | Exceptional $100,101 |
| Immigrants | Afghanistan | 95.3 /100 | #110 | Exceptional $99,977 |