Immigrants from Uganda vs Immigrants from Ethiopia Median Male Earnings
COMPARE
Immigrants from Uganda
Immigrants from Ethiopia
Median Male Earnings
Median Male Earnings Comparison
Immigrants from Uganda
Immigrants from Ethiopia
$56,064
MEDIAN MALE EARNINGS
82.4/ 100
METRIC RATING
144th/ 347
METRIC RANK
$55,434
MEDIAN MALE EARNINGS
71.6/ 100
METRIC RATING
156th/ 347
METRIC RANK
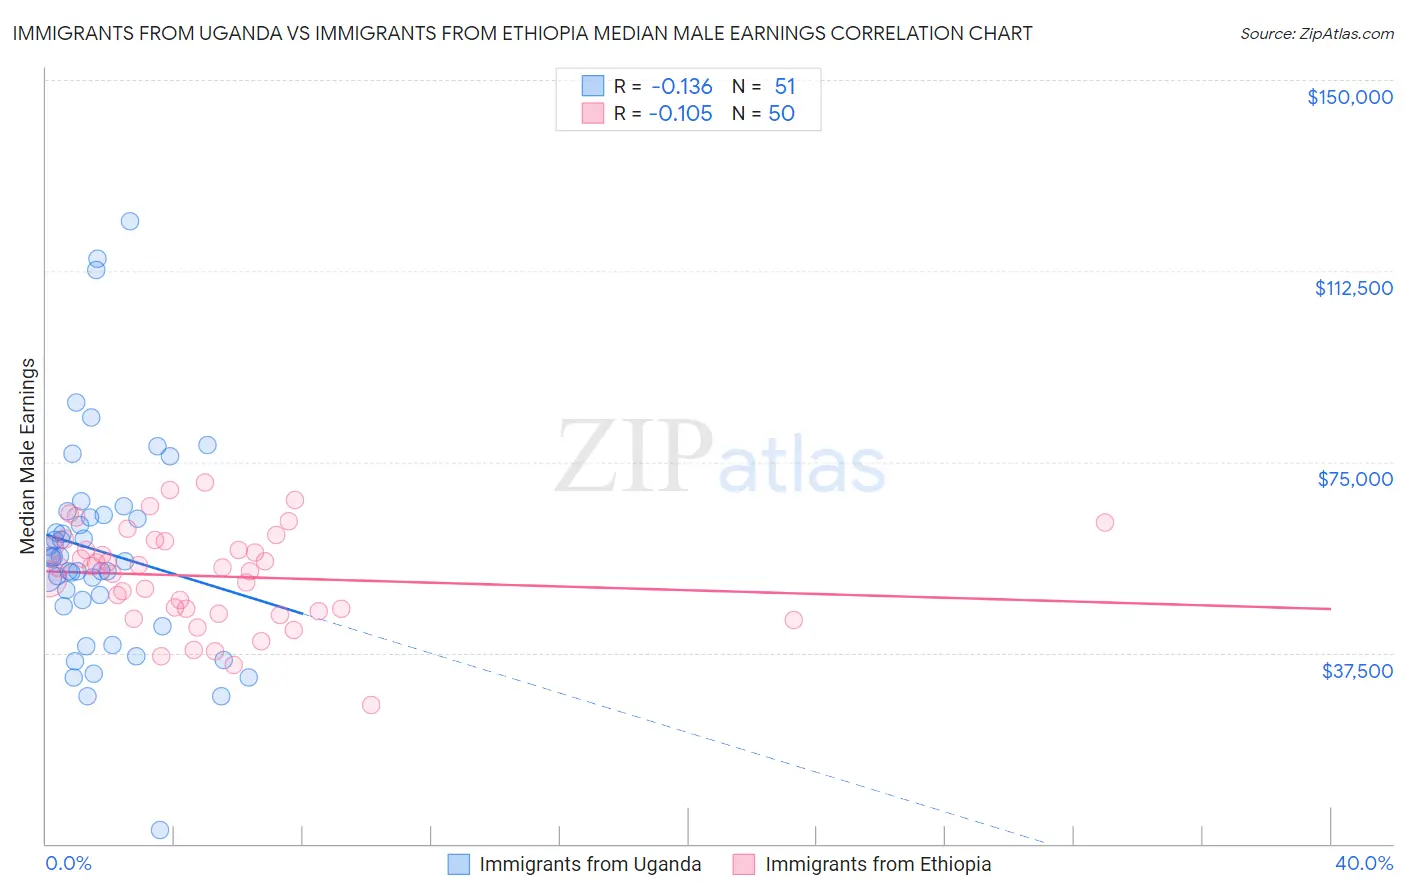
Immigrants from Uganda vs Immigrants from Ethiopia Median Male Earnings Correlation Chart
The statistical analysis conducted on geographies consisting of 125,972,834 people shows a poor negative correlation between the proportion of Immigrants from Uganda and median male earnings in the United States with a correlation coefficient (R) of -0.136 and weighted average of $56,064. Similarly, the statistical analysis conducted on geographies consisting of 211,550,468 people shows a poor negative correlation between the proportion of Immigrants from Ethiopia and median male earnings in the United States with a correlation coefficient (R) of -0.105 and weighted average of $55,434, a difference of 1.1%.
Median Male Earnings Correlation Summary
| Measurement | Immigrants from Uganda | Immigrants from Ethiopia |
| Minimum | $2,614 | $27,233 |
| Maximum | $122,344 | $70,982 |
| Range | $119,730 | $43,749 |
| Mean | $57,441 | $52,533 |
| Median | $56,129 | $54,177 |
| Interquartile 25% (IQ1) | $46,713 | $45,679 |
| Interquartile 75% (IQ3) | $64,485 | $59,341 |
| Interquartile Range (IQR) | $17,772 | $13,662 |
| Standard Deviation (Sample) | $21,598 | $9,594 |
| Standard Deviation (Population) | $21,385 | $9,497 |
Demographics Similar to Immigrants from Uganda and Immigrants from Ethiopia by Median Male Earnings
In terms of median male earnings, the demographic groups most similar to Immigrants from Uganda are Sri Lankan ($56,136, a difference of 0.13%), Norwegian ($55,965, a difference of 0.18%), Immigrants from Chile ($55,954, a difference of 0.20%), Danish ($56,246, a difference of 0.32%), and Ethiopian ($56,243, a difference of 0.32%). Similarly, the demographic groups most similar to Immigrants from Ethiopia are Icelander ($55,415, a difference of 0.030%), Czechoslovakian ($55,382, a difference of 0.090%), Alsatian ($55,380, a difference of 0.10%), Basque ($55,370, a difference of 0.12%), and Scandinavian ($55,527, a difference of 0.17%).
| Demographics | Rating | Rank | Median Male Earnings |
| Luxembourgers | 85.5 /100 | #140 | Excellent $56,300 |
| Danes | 84.8 /100 | #141 | Excellent $56,246 |
| Ethiopians | 84.8 /100 | #142 | Excellent $56,243 |
| Sri Lankans | 83.4 /100 | #143 | Excellent $56,136 |
| Immigrants | Uganda | 82.4 /100 | #144 | Excellent $56,064 |
| Norwegians | 80.9 /100 | #145 | Excellent $55,965 |
| Immigrants | Chile | 80.7 /100 | #146 | Excellent $55,954 |
| Immigrants | Philippines | 78.4 /100 | #147 | Good $55,809 |
| Scottish | 78.2 /100 | #148 | Good $55,793 |
| English | 77.4 /100 | #149 | Good $55,747 |
| Swiss | 77.1 /100 | #150 | Good $55,731 |
| Immigrants | Oceania | 76.8 /100 | #151 | Good $55,712 |
| Peruvians | 75.8 /100 | #152 | Good $55,659 |
| Immigrants | Nepal | 75.0 /100 | #153 | Good $55,615 |
| Taiwanese | 73.9 /100 | #154 | Good $55,556 |
| Scandinavians | 73.4 /100 | #155 | Good $55,527 |
| Immigrants | Ethiopia | 71.6 /100 | #156 | Good $55,434 |
| Icelanders | 71.2 /100 | #157 | Good $55,415 |
| Czechoslovakians | 70.5 /100 | #158 | Good $55,382 |
| Alsatians | 70.5 /100 | #159 | Good $55,380 |
| Basques | 70.3 /100 | #160 | Good $55,370 |