Palestinian vs Immigrants from Ethiopia Single Female Poverty
COMPARE
Palestinian
Immigrants from Ethiopia
Single Female Poverty
Single Female Poverty Comparison
Palestinians
Immigrants from Ethiopia
19.2%
SINGLE FEMALE POVERTY
99.6/ 100
METRIC RATING
66th/ 347
METRIC RANK
20.0%
SINGLE FEMALE POVERTY
95.4/ 100
METRIC RATING
119th/ 347
METRIC RANK
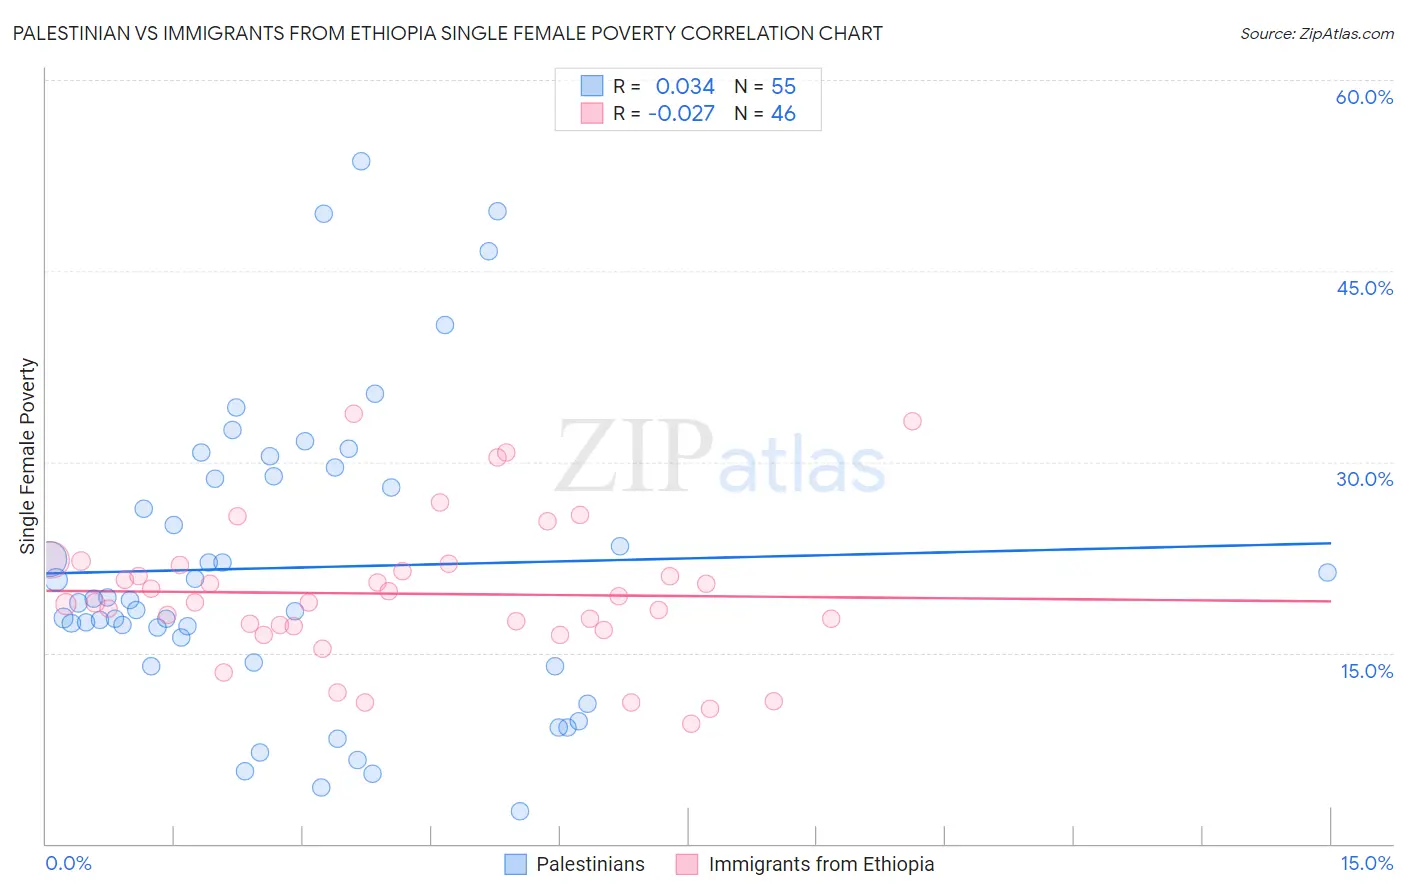
Palestinian vs Immigrants from Ethiopia Single Female Poverty Correlation Chart
The statistical analysis conducted on geographies consisting of 214,894,692 people shows no correlation between the proportion of Palestinians and poverty level among single females in the United States with a correlation coefficient (R) of 0.034 and weighted average of 19.2%. Similarly, the statistical analysis conducted on geographies consisting of 210,222,797 people shows no correlation between the proportion of Immigrants from Ethiopia and poverty level among single females in the United States with a correlation coefficient (R) of -0.027 and weighted average of 20.0%, a difference of 4.1%.
Single Female Poverty Correlation Summary
| Measurement | Palestinian | Immigrants from Ethiopia |
| Minimum | 2.6% | 9.4% |
| Maximum | 53.6% | 33.7% |
| Range | 51.0% | 24.3% |
| Mean | 21.7% | 19.6% |
| Median | 19.1% | 19.0% |
| Interquartile 25% (IQ1) | 14.2% | 17.1% |
| Interquartile 75% (IQ3) | 28.9% | 21.9% |
| Interquartile Range (IQR) | 14.7% | 4.8% |
| Standard Deviation (Sample) | 11.7% | 5.6% |
| Standard Deviation (Population) | 11.6% | 5.5% |
Similar Demographics by Single Female Poverty
Demographics Similar to Palestinians by Single Female Poverty
In terms of single female poverty, the demographic groups most similar to Palestinians are Cypriot (19.2%, a difference of 0.020%), Immigrants from Europe (19.2%, a difference of 0.040%), Immigrants from Egypt (19.2%, a difference of 0.040%), Immigrants from Northern Europe (19.2%, a difference of 0.050%), and Laotian (19.3%, a difference of 0.080%).
| Demographics | Rating | Rank | Single Female Poverty |
| Sri Lankans | 99.6 /100 | #59 | Exceptional 19.2% |
| Russians | 99.6 /100 | #60 | Exceptional 19.2% |
| Cambodians | 99.6 /100 | #61 | Exceptional 19.2% |
| Lithuanians | 99.6 /100 | #62 | Exceptional 19.2% |
| Immigrants | Northern Europe | 99.6 /100 | #63 | Exceptional 19.2% |
| Immigrants | Europe | 99.6 /100 | #64 | Exceptional 19.2% |
| Cypriots | 99.6 /100 | #65 | Exceptional 19.2% |
| Palestinians | 99.6 /100 | #66 | Exceptional 19.2% |
| Immigrants | Egypt | 99.6 /100 | #67 | Exceptional 19.2% |
| Laotians | 99.5 /100 | #68 | Exceptional 19.3% |
| Paraguayans | 99.5 /100 | #69 | Exceptional 19.3% |
| Immigrants | Jordan | 99.4 /100 | #70 | Exceptional 19.3% |
| Immigrants | South Eastern Asia | 99.4 /100 | #71 | Exceptional 19.3% |
| Immigrants | Latvia | 99.4 /100 | #72 | Exceptional 19.3% |
| Immigrants | Peru | 99.4 /100 | #73 | Exceptional 19.3% |
Demographics Similar to Immigrants from Ethiopia by Single Female Poverty
In terms of single female poverty, the demographic groups most similar to Immigrants from Ethiopia are Immigrants from Afghanistan (20.0%, a difference of 0.0%), Polish (20.0%, a difference of 0.080%), South American (20.0%, a difference of 0.10%), Immigrants from Kazakhstan (20.0%, a difference of 0.12%), and Immigrants from Switzerland (20.0%, a difference of 0.13%).
| Demographics | Rating | Rank | Single Female Poverty |
| Immigrants | Netherlands | 96.0 /100 | #112 | Exceptional 20.0% |
| Immigrants | Zimbabwe | 95.9 /100 | #113 | Exceptional 20.0% |
| Immigrants | Colombia | 95.9 /100 | #114 | Exceptional 20.0% |
| Immigrants | Northern Africa | 95.8 /100 | #115 | Exceptional 20.0% |
| Immigrants | Kazakhstan | 95.7 /100 | #116 | Exceptional 20.0% |
| Poles | 95.6 /100 | #117 | Exceptional 20.0% |
| Immigrants | Afghanistan | 95.4 /100 | #118 | Exceptional 20.0% |
| Immigrants | Ethiopia | 95.4 /100 | #119 | Exceptional 20.0% |
| South Americans | 95.1 /100 | #120 | Exceptional 20.0% |
| Immigrants | Switzerland | 95.1 /100 | #121 | Exceptional 20.0% |
| Immigrants | South America | 95.0 /100 | #122 | Exceptional 20.0% |
| Brazilians | 94.4 /100 | #123 | Exceptional 20.1% |
| Immigrants | Chile | 94.3 /100 | #124 | Exceptional 20.1% |
| Immigrants | South Africa | 93.9 /100 | #125 | Exceptional 20.1% |
| Serbians | 93.3 /100 | #126 | Exceptional 20.1% |