Palestinian vs Immigrants from Ethiopia Unemployment Among Ages 20 to 24 years

COMPARE

Palestinian
Race
Ancestry
AfghanAfricanAlaska NativeAlaskan AthabascanAlbanianAleutAlsatianAmericanApacheArabArapahoArgentineanArmenianAssyrian/Chaldean/SyriacAustralianAustrianBahamianBangladeshiBarbadianBasqueBelgianBelizeanBermudanBhutaneseBlackfeetBolivianBrazilianBritishBritish West IndianBulgarianBurmeseCajunCambodianCanadianCape VerdeanCarpatho RusynCelticCentral AmericanCentral American IndianCherokeeCheyenneChickasawChileanChineseChippewaChoctawColombianColvilleComancheCosta RicanCreeCreekCroatianCrowCubanCypriotCzechCzechoslovakianDanishDelawareDominicanDutchDutch West IndianEastern EuropeanEcuadorianEgyptianEnglishEstonianEthiopianEuropeanFijianFilipinoFinnishFrenchFrench American IndianFrench CanadianGermanGerman RussianGhanaianGreekGuamanian/ChamorroGuatemalanGuyaneseHaitianHmongHonduranHopiHoumaHungarianIcelanderIndian (Asian)IndonesianInupiatIranianIraqiIrishIroquoisIsraeliItalianJamaicanJapaneseJordanianKenyanKiowaKoreanLaotianLatvianLebaneseLiberianLithuanianLumbeeLuxembourgerMacedonianMalaysianMalteseMarshalleseMenomineeMexicanMexican American IndianMongolianMoroccanNative HawaiianNavajoNepaleseNew ZealanderNicaraguanNigerianNorthern EuropeanNorwegianOkinawanOsageOttawaPaiutePakistaniPalestinianPanamanianParaguayanPennsylvania GermanPeruvianPimaPolishPortuguesePotawatomiPuebloPuerto RicanPuget Sound SalishRomanianRussianSalvadoranSamoanScandinavianScotch-IrishScottishSeminoleSenegaleseSerbianShoshoneSierra LeoneanSiouxSlavicSlovakSloveneSomaliSouth AfricanSouth AmericanSouth American IndianSoviet UnionSpaniardSpanishSpanish AmericanSpanish American IndianSri LankanSubsaharan AfricanSudaneseSwedishSwissSyrianTaiwaneseThaiTlingit-HaidaTohono O'OdhamTonganTrinidadian and TobagonianTsimshianTurkishU.S. Virgin IslanderUgandanUkrainianUruguayanUteVenezuelanVietnameseWelshWest IndianYakamaYaquiYugoslavianYumanYup'ikZimbabwean
Immigration
NonimmigrantsImmigrantsAfghanistanAfricaAlbaniaArgentinaArmeniaAsiaAustraliaAustriaBahamasBangladeshBarbadosBelarusBelgiumBelizeBoliviaBosnia and HerzegovinaBrazilBulgariaBurma/MyanmarCabo VerdeCambodiaCameroonCanadaCaribbeanCentral AmericaChileChinaColombiaCongoCosta RicaCroatiaCubaCzechoslovakiaDenmarkDominicaDominican RepublicEastern AfricaEastern AsiaEastern EuropeEcuadorEgyptEl SalvadorEnglandEritreaEuropeFijiFranceGermanyGhanaGreeceGrenadaGuatemalaGuyanaHaitiHondurasHong KongHungaryIndiaIndonesiaIranIraqIrelandIsraelItalyJamaicaJapanJordanKazakhstanKenyaKoreaKuwaitLaosLatin AmericaLatviaLebanonLiberiaLithuaniaMalaysiaMexicoMicronesiaMiddle AfricaMoldovaMoroccoNepalNetherlandsNicaraguaNigeriaNorth AmericaNorth MacedoniaNorthern AfricaNorthern EuropeNorwayOceaniaPakistanPanamaPeruPhilippinesPolandPortugalRomaniaRussiaSaudi ArabiaScotlandSenegalSerbiaSierra LeoneSingaporeSomaliaSouth AfricaSouth AmericaSouth Central AsiaSouth Eastern AsiaSouthern EuropeSpainSri LankaSt. Vincent and the GrenadinesSudanSwedenSwitzerlandSyriaTaiwanThailandTrinidad and TobagoTurkeyUgandaUkraineUruguayUzbekistanVenezuelaVietnamWest IndiesWestern AfricaWestern AsiaWestern EuropeYemenZaireZimbabweAzores
Immigrants from Ethiopia
Race
Ancestry
AfghanAfricanAlaska NativeAlaskan AthabascanAlbanianAleutAlsatianAmericanApacheArabArapahoArgentineanArmenianAssyrian/Chaldean/SyriacAustralianAustrianBahamianBangladeshiBarbadianBasqueBelgianBelizeanBermudanBhutaneseBlackfeetBolivianBrazilianBritishBritish West IndianBulgarianBurmeseCajunCambodianCanadianCape VerdeanCarpatho RusynCelticCentral AmericanCentral American IndianCherokeeCheyenneChickasawChileanChineseChippewaChoctawColombianColvilleComancheCosta RicanCreeCreekCroatianCrowCubanCypriotCzechCzechoslovakianDanishDelawareDominicanDutchDutch West IndianEastern EuropeanEcuadorianEgyptianEnglishEstonianEthiopianEuropeanFijianFilipinoFinnishFrenchFrench American IndianFrench CanadianGermanGerman RussianGhanaianGreekGuamanian/ChamorroGuatemalanGuyaneseHaitianHmongHonduranHopiHoumaHungarianIcelanderIndian (Asian)IndonesianInupiatIranianIraqiIrishIroquoisIsraeliItalianJamaicanJapaneseJordanianKenyanKiowaKoreanLaotianLatvianLebaneseLiberianLithuanianLumbeeLuxembourgerMacedonianMalaysianMalteseMarshalleseMenomineeMexicanMexican American IndianMongolianMoroccanNative HawaiianNavajoNepaleseNew ZealanderNicaraguanNigerianNorthern EuropeanNorwegianOkinawanOsageOttawaPaiutePakistaniPanamanianParaguayanPennsylvania GermanPeruvianPimaPolishPortuguesePotawatomiPuebloPuerto RicanPuget Sound SalishRomanianRussianSalvadoranSamoanScandinavianScotch-IrishScottishSeminoleSenegaleseSerbianShoshoneSierra LeoneanSiouxSlavicSlovakSloveneSomaliSouth AfricanSouth AmericanSouth American IndianSoviet UnionSpaniardSpanishSpanish AmericanSpanish American IndianSri LankanSubsaharan AfricanSudaneseSwedishSwissSyrianTaiwaneseThaiTlingit-HaidaTohono O'OdhamTonganTrinidadian and TobagonianTsimshianTurkishU.S. Virgin IslanderUgandanUkrainianUruguayanUteVenezuelanVietnameseWelshWest IndianYakamaYaquiYugoslavianYumanYup'ikZimbabwean
Immigration
NonimmigrantsImmigrantsAfghanistanAfricaAlbaniaArgentinaArmeniaAsiaAustraliaAustriaBahamasBangladeshBarbadosBelarusBelgiumBelizeBoliviaBosnia and HerzegovinaBrazilBulgariaBurma/MyanmarCabo VerdeCambodiaCameroonCanadaCaribbeanCentral AmericaChileChinaColombiaCongoCosta RicaCroatiaCubaCzechoslovakiaDenmarkDominicaDominican RepublicEastern AfricaEastern AsiaEastern EuropeEcuadorEgyptEl SalvadorEnglandEritreaEthiopiaEuropeFijiFranceGermanyGhanaGreeceGrenadaGuatemalaGuyanaHaitiHondurasHong KongHungaryIndiaIndonesiaIranIraqIrelandIsraelItalyJamaicaJapanJordanKazakhstanKenyaKoreaKuwaitLaosLatin AmericaLatviaLebanonLiberiaLithuaniaMalaysiaMexicoMicronesiaMiddle AfricaMoldovaMoroccoNepalNetherlandsNicaraguaNigeriaNorth AmericaNorth MacedoniaNorthern AfricaNorthern EuropeNorwayOceaniaPakistanPanamaPeruPhilippinesPolandPortugalRomaniaRussiaSaudi ArabiaScotlandSenegalSerbiaSierra LeoneSingaporeSomaliaSouth AfricaSouth AmericaSouth Central AsiaSouth Eastern AsiaSouthern EuropeSpainSri LankaSt. Vincent and the GrenadinesSudanSwedenSwitzerlandSyriaTaiwanThailandTrinidad and TobagoTurkeyUgandaUkraineUruguayUzbekistanVenezuelaVietnamWest IndiesWestern AfricaWestern AsiaWestern EuropeYemenZaireZimbabweAzores
Unemployment Among Ages 20 to 24 years
Income
Poverty
Unemployment
Labor Participation
Family Structure
Vehicle Availability
Education Level
Disability

Unemployment Among Ages 20 to 24 years Comparison

Palestinians

Immigrants from Ethiopia

Tragic
Exceptional
10.6%
UNEMPLOYMENT AMONG AGES 20 TO 24 YEARS
4.9/ 100
METRIC RATING
227th/ 347
METRIC RANK
9.6%
UNEMPLOYMENT AMONG AGES 20 TO 24 YEARS
99.9/ 100
METRIC RATING
40th/ 347
METRIC RANK

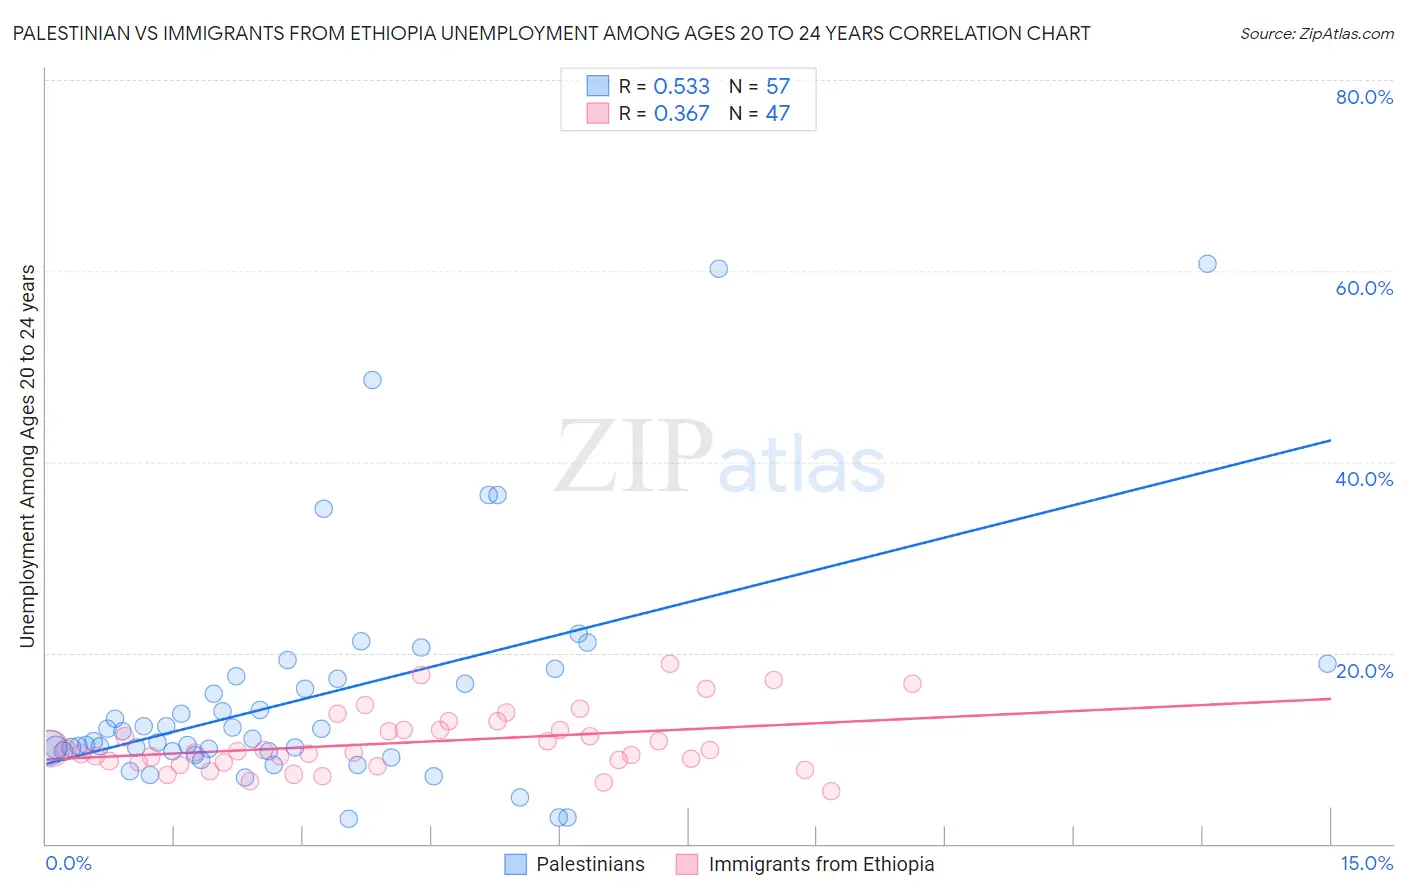
Palestinian vs Immigrants from Ethiopia Unemployment Among Ages 20 to 24 years Correlation Chart

The statistical analysis conducted on geographies consisting of 214,060,905 people shows a substantial positive correlation between the proportion of Palestinians and unemployment rate among population between the ages 20 and 24 in the United States with a correlation coefficient (R) of 0.533 and weighted average of 10.6%. Similarly, the statistical analysis conducted on geographies consisting of 209,163,502 people shows a mild positive correlation between the proportion of Immigrants from Ethiopia and unemployment rate among population between the ages 20 and 24 in the United States with a correlation coefficient (R) of 0.367 and weighted average of 9.6%, a difference of 10.0%.
Palestinian vs Immigrants from Ethiopia Unemployment Among Ages 20 to 24 years

Unemployment Among Ages 20 to 24 years Correlation Summary

MeasurementPalestinianImmigrants from Ethiopia
Minimum2.6%5.5%
Maximum60.8%18.8%
Range58.2%13.3%
Mean15.4%10.6%
Median11.1%9.7%
Interquartile 25% (IQ1)9.7%8.5%
Interquartile 75% (IQ3)17.4%11.9%
Interquartile Range (IQR)7.8%3.4%
Standard Deviation (Sample)12.1%3.1%
Standard Deviation (Population)12.0%3.1%

Similar Demographics by Unemployment Among Ages 20 to 24 years

Demographics Similar to Palestinians by Unemployment Among Ages 20 to 24 years

In terms of unemployment among ages 20 to 24 years, the demographic groups most similar to Palestinians are Immigrants from Costa Rica (10.6%, a difference of 0.0%), Immigrants from South America (10.6%, a difference of 0.030%), Nepalese (10.6%, a difference of 0.040%), Mexican American Indian (10.6%, a difference of 0.070%), and American (10.6%, a difference of 0.11%).
DemographicsRating | RankUnemployment Among Ages 20 to 24 years
Eastern Europeans
6.9
/100
|
#220
Tragic
10.6%
Central Americans
6.8
/100
|
#221
Tragic
10.6%
Immigrants | Poland
6.4
/100
|
#222
Tragic
10.6%
Arabs
5.6
/100
|
#223
Tragic
10.6%
Nepalese
5.1
/100
|
#224
Tragic
10.6%
Immigrants | South America
5.1
/100
|
#225
Tragic
10.6%
Immigrants | Costa Rica
4.9
/100
|
#226
Tragic
10.6%
Palestinians
4.9
/100
|
#227
Tragic
10.6%
Mexican American Indians
4.6
/100
|
#228
Tragic
10.6%
Americans
4.4
/100
|
#229
Tragic
10.6%
French American Indians
4.1
/100
|
#230
Tragic
10.6%
Native Hawaiians
3.9
/100
|
#231
Tragic
10.6%
Israelis
3.7
/100
|
#232
Tragic
10.6%
Choctaw
3.6
/100
|
#233
Tragic
10.6%
Immigrants | Africa
3.5
/100
|
#234
Tragic
10.6%

Demographics Similar to Immigrants from Ethiopia by Unemployment Among Ages 20 to 24 years

In terms of unemployment among ages 20 to 24 years, the demographic groups most similar to Immigrants from Ethiopia are Dutch (9.6%, a difference of 0.040%), Afghan (9.6%, a difference of 0.27%), Immigrants from Zaire (9.6%, a difference of 0.33%), Belgian (9.6%, a difference of 0.41%), and German (9.6%, a difference of 0.45%).
DemographicsRating | RankUnemployment Among Ages 20 to 24 years
Australians
100.0
/100
|
#33
Exceptional
9.6%
Yugoslavians
100.0
/100
|
#34
Exceptional
9.6%
Germans
100.0
/100
|
#35
Exceptional
9.6%
Belgians
100.0
/100
|
#36
Exceptional
9.6%
Immigrants | Zaire
100.0
/100
|
#37
Exceptional
9.6%
Afghans
99.9
/100
|
#38
Exceptional
9.6%
Dutch
99.9
/100
|
#39
Exceptional
9.6%
Immigrants | Ethiopia
99.9
/100
|
#40
Exceptional
9.6%
Swiss
99.9
/100
|
#41
Exceptional
9.7%
Immigrants | Saudi Arabia
99.9
/100
|
#42
Exceptional
9.7%
Menominee
99.8
/100
|
#43
Exceptional
9.7%
Europeans
99.8
/100
|
#44
Exceptional
9.7%
Croatians
99.8
/100
|
#45
Exceptional
9.7%
Immigrants | Nicaragua
99.8
/100
|
#46
Exceptional
9.7%
Immigrants | India
99.8
/100
|
#47
Exceptional
9.7%