Nicaraguan vs Immigrants from Ethiopia Median Male Earnings
COMPARE
Nicaraguan
Immigrants from Ethiopia
Median Male Earnings
Median Male Earnings Comparison
Nicaraguans
Immigrants from Ethiopia
$49,215
MEDIAN MALE EARNINGS
0.6/ 100
METRIC RATING
263rd/ 347
METRIC RANK
$55,434
MEDIAN MALE EARNINGS
71.6/ 100
METRIC RATING
156th/ 347
METRIC RANK
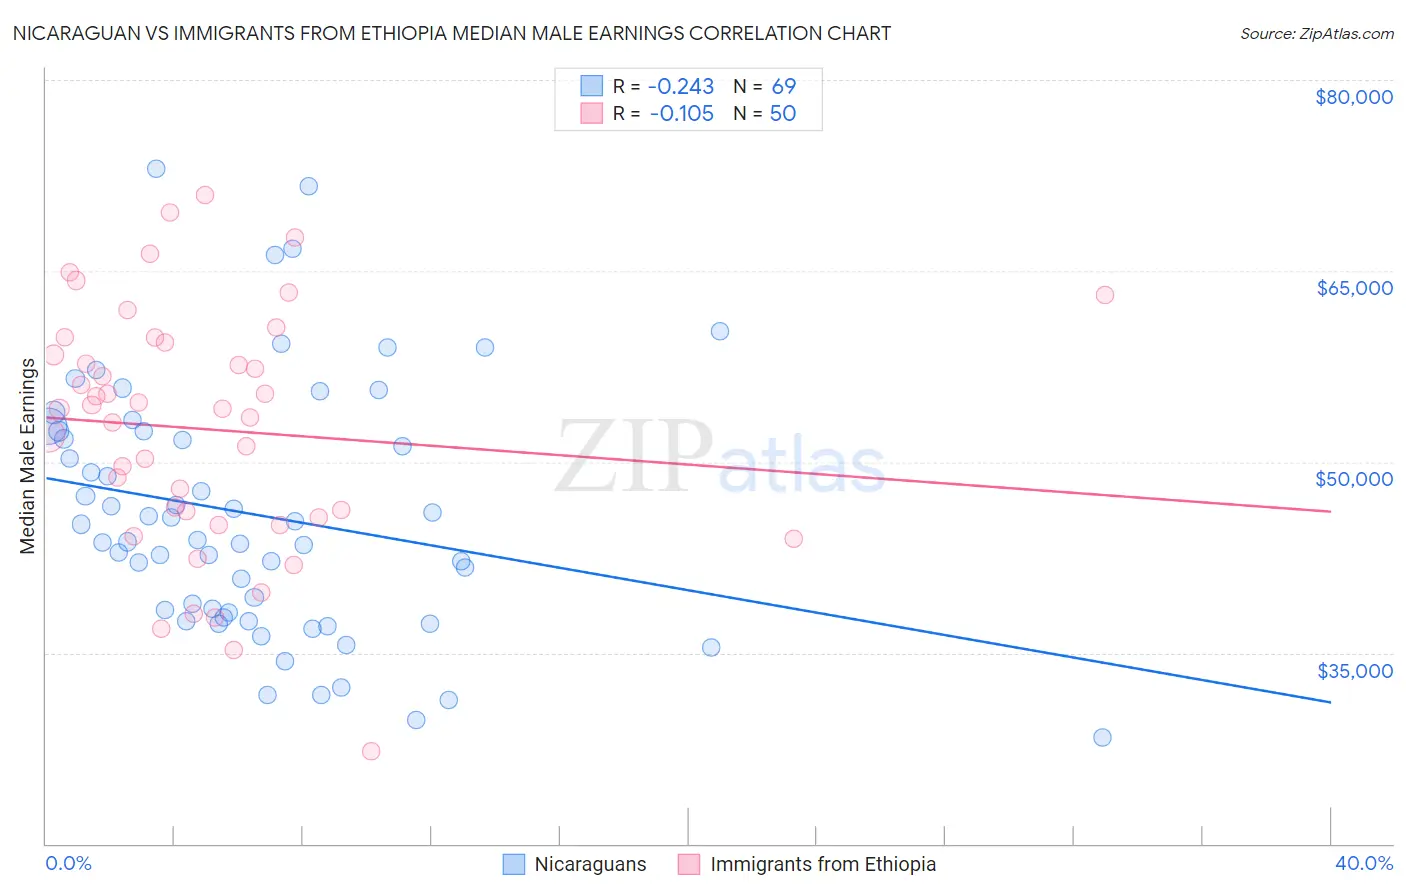
Nicaraguan vs Immigrants from Ethiopia Median Male Earnings Correlation Chart
The statistical analysis conducted on geographies consisting of 285,681,688 people shows a weak negative correlation between the proportion of Nicaraguans and median male earnings in the United States with a correlation coefficient (R) of -0.243 and weighted average of $49,215. Similarly, the statistical analysis conducted on geographies consisting of 211,550,468 people shows a poor negative correlation between the proportion of Immigrants from Ethiopia and median male earnings in the United States with a correlation coefficient (R) of -0.105 and weighted average of $55,434, a difference of 12.6%.
Median Male Earnings Correlation Summary
| Measurement | Nicaraguan | Immigrants from Ethiopia |
| Minimum | $28,353 | $27,233 |
| Maximum | $73,045 | $70,982 |
| Range | $44,692 | $43,749 |
| Mean | $45,837 | $52,533 |
| Median | $43,824 | $54,177 |
| Interquartile 25% (IQ1) | $37,970 | $45,679 |
| Interquartile 75% (IQ3) | $52,426 | $59,341 |
| Interquartile Range (IQR) | $14,456 | $13,662 |
| Standard Deviation (Sample) | $9,879 | $9,594 |
| Standard Deviation (Population) | $9,808 | $9,497 |
Similar Demographics by Median Male Earnings
Demographics Similar to Nicaraguans by Median Male Earnings
In terms of median male earnings, the demographic groups most similar to Nicaraguans are Immigrants from Middle Africa ($49,201, a difference of 0.030%), Immigrants from Laos ($49,190, a difference of 0.050%), Immigrants from West Indies ($49,271, a difference of 0.11%), Liberian ($49,318, a difference of 0.21%), and Iroquois ($49,374, a difference of 0.32%).
| Demographics | Rating | Rank | Median Male Earnings |
| Alaska Natives | 0.9 /100 | #256 | Tragic $49,711 |
| British West Indians | 0.8 /100 | #257 | Tragic $49,636 |
| Cree | 0.7 /100 | #258 | Tragic $49,497 |
| Nepalese | 0.7 /100 | #259 | Tragic $49,458 |
| Iroquois | 0.7 /100 | #260 | Tragic $49,374 |
| Liberians | 0.6 /100 | #261 | Tragic $49,318 |
| Immigrants | West Indies | 0.6 /100 | #262 | Tragic $49,271 |
| Nicaraguans | 0.6 /100 | #263 | Tragic $49,215 |
| Immigrants | Middle Africa | 0.6 /100 | #264 | Tragic $49,201 |
| Immigrants | Laos | 0.6 /100 | #265 | Tragic $49,190 |
| Somalis | 0.5 /100 | #266 | Tragic $49,025 |
| Spanish Americans | 0.5 /100 | #267 | Tragic $49,008 |
| Ute | 0.4 /100 | #268 | Tragic $48,899 |
| Tsimshian | 0.4 /100 | #269 | Tragic $48,836 |
| Potawatomi | 0.4 /100 | #270 | Tragic $48,768 |
Demographics Similar to Immigrants from Ethiopia by Median Male Earnings
In terms of median male earnings, the demographic groups most similar to Immigrants from Ethiopia are Icelander ($55,415, a difference of 0.030%), Czechoslovakian ($55,382, a difference of 0.090%), Alsatian ($55,380, a difference of 0.10%), Basque ($55,370, a difference of 0.12%), and Belgian ($55,361, a difference of 0.13%).
| Demographics | Rating | Rank | Median Male Earnings |
| English | 77.4 /100 | #149 | Good $55,747 |
| Swiss | 77.1 /100 | #150 | Good $55,731 |
| Immigrants | Oceania | 76.8 /100 | #151 | Good $55,712 |
| Peruvians | 75.8 /100 | #152 | Good $55,659 |
| Immigrants | Nepal | 75.0 /100 | #153 | Good $55,615 |
| Taiwanese | 73.9 /100 | #154 | Good $55,556 |
| Scandinavians | 73.4 /100 | #155 | Good $55,527 |
| Immigrants | Ethiopia | 71.6 /100 | #156 | Good $55,434 |
| Icelanders | 71.2 /100 | #157 | Good $55,415 |
| Czechoslovakians | 70.5 /100 | #158 | Good $55,382 |
| Alsatians | 70.5 /100 | #159 | Good $55,380 |
| Basques | 70.3 /100 | #160 | Good $55,370 |
| Belgians | 70.1 /100 | #161 | Good $55,361 |
| French | 69.9 /100 | #162 | Good $55,350 |
| Ugandans | 68.6 /100 | #163 | Good $55,290 |