Immigrants from Iraq vs Swiss Median Female Earnings
COMPARE
Immigrants from Iraq
Swiss
Median Female Earnings
Median Female Earnings Comparison
Immigrants from Iraq
Swiss
$37,864
MEDIAN FEMALE EARNINGS
2.2/ 100
METRIC RATING
250th/ 347
METRIC RANK
$37,904
MEDIAN FEMALE EARNINGS
2.3/ 100
METRIC RATING
249th/ 347
METRIC RANK
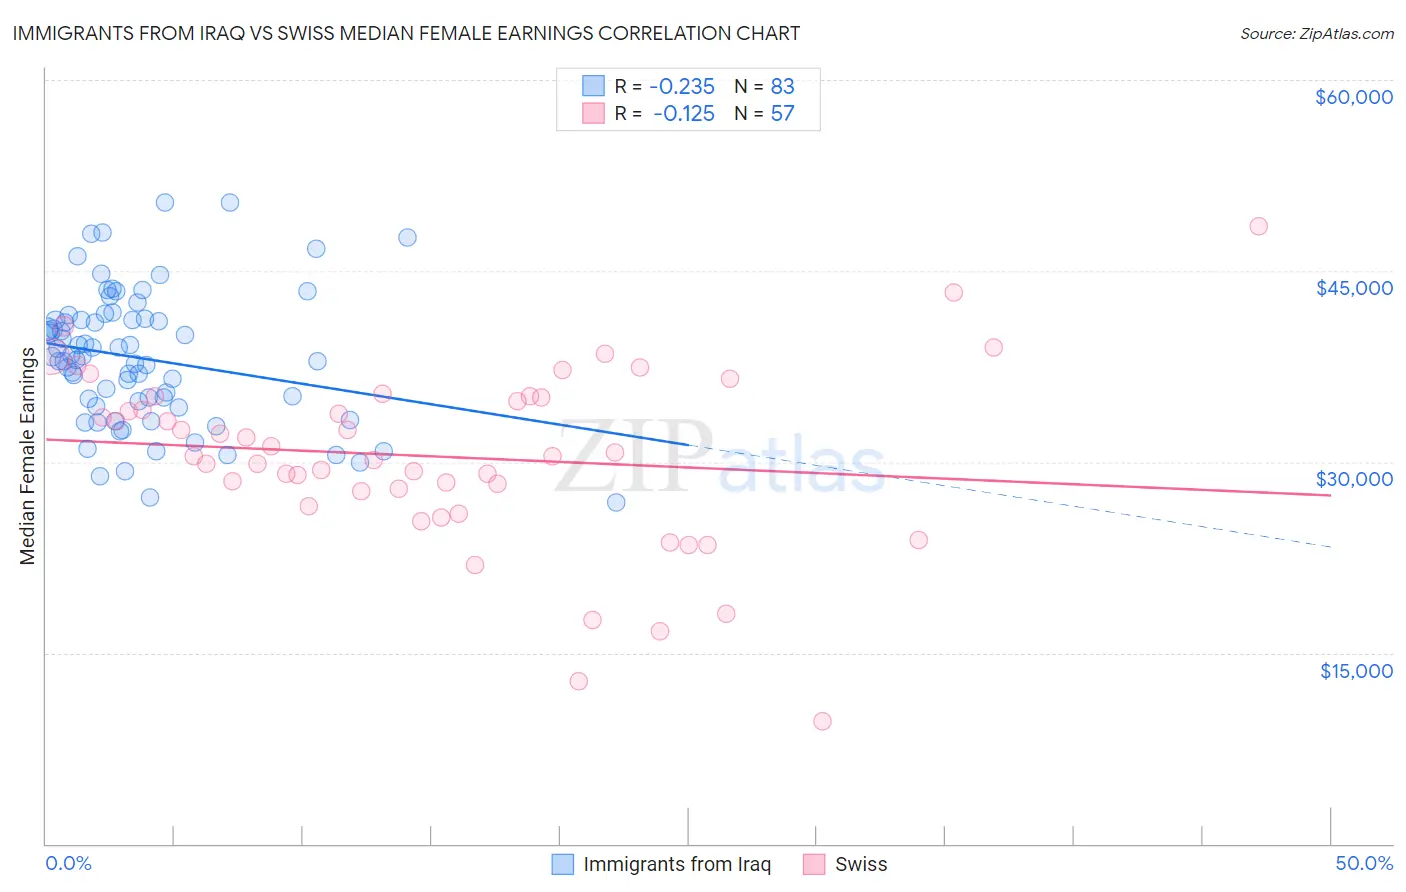
Immigrants from Iraq vs Swiss Median Female Earnings Correlation Chart
The statistical analysis conducted on geographies consisting of 194,712,722 people shows a weak negative correlation between the proportion of Immigrants from Iraq and median female earnings in the United States with a correlation coefficient (R) of -0.235 and weighted average of $37,864. Similarly, the statistical analysis conducted on geographies consisting of 464,484,716 people shows a poor negative correlation between the proportion of Swiss and median female earnings in the United States with a correlation coefficient (R) of -0.125 and weighted average of $37,904, a difference of 0.11%.
Median Female Earnings Correlation Summary
| Measurement | Immigrants from Iraq | Swiss |
| Minimum | $26,764 | $9,649 |
| Maximum | $50,383 | $48,533 |
| Range | $23,619 | $38,884 |
| Mean | $38,116 | $30,422 |
| Median | $38,258 | $30,468 |
| Interquartile 25% (IQ1) | $34,416 | $27,075 |
| Interquartile 75% (IQ3) | $41,190 | $35,111 |
| Interquartile Range (IQR) | $6,774 | $8,036 |
| Standard Deviation (Sample) | $5,230 | $7,120 |
| Standard Deviation (Population) | $5,199 | $7,057 |
Demographics Similar to Immigrants from Iraq and Swiss by Median Female Earnings
In terms of median female earnings, the demographic groups most similar to Immigrants from Iraq are Welsh ($37,856, a difference of 0.020%), Immigrants from Dominica ($37,825, a difference of 0.10%), Alaskan Athabascan ($37,905, a difference of 0.11%), Immigrants from Somalia ($37,914, a difference of 0.13%), and Immigrants from Middle Africa ($37,965, a difference of 0.27%). Similarly, the demographic groups most similar to Swiss are Alaskan Athabascan ($37,905, a difference of 0.0%), Immigrants from Somalia ($37,914, a difference of 0.030%), Welsh ($37,856, a difference of 0.13%), Immigrants from Middle Africa ($37,965, a difference of 0.16%), and Delaware ($37,964, a difference of 0.16%).
| Demographics | Rating | Rank | Median Female Earnings |
| English | 4.2 /100 | #239 | Tragic $38,196 |
| Finns | 4.0 /100 | #240 | Tragic $38,173 |
| Spanish | 3.5 /100 | #241 | Tragic $38,098 |
| Immigrants | Burma/Myanmar | 3.0 /100 | #242 | Tragic $38,028 |
| Germans | 2.8 /100 | #243 | Tragic $37,986 |
| Immigrants | Liberia | 2.7 /100 | #244 | Tragic $37,970 |
| Immigrants | Middle Africa | 2.7 /100 | #245 | Tragic $37,965 |
| Delaware | 2.6 /100 | #246 | Tragic $37,964 |
| Immigrants | Somalia | 2.4 /100 | #247 | Tragic $37,914 |
| Alaskan Athabascans | 2.3 /100 | #248 | Tragic $37,905 |
| Swiss | 2.3 /100 | #249 | Tragic $37,904 |
| Immigrants | Iraq | 2.2 /100 | #250 | Tragic $37,864 |
| Welsh | 2.1 /100 | #251 | Tragic $37,856 |
| Immigrants | Dominica | 2.0 /100 | #252 | Tragic $37,825 |
| Danes | 1.6 /100 | #253 | Tragic $37,730 |
| Whites/Caucasians | 1.1 /100 | #254 | Tragic $37,531 |
| Colville | 1.1 /100 | #255 | Tragic $37,514 |
| Samoans | 1.0 /100 | #256 | Tragic $37,498 |
| Hawaiians | 1.0 /100 | #257 | Tragic $37,497 |
| Belizeans | 0.9 /100 | #258 | Tragic $37,429 |
| Scotch-Irish | 0.8 /100 | #259 | Tragic $37,383 |