Immigrants from Venezuela vs Swiss Median Female Earnings
COMPARE
Immigrants from Venezuela
Swiss
Median Female Earnings
Median Female Earnings Comparison
Immigrants from Venezuela
Swiss
$37,003
MEDIAN FEMALE EARNINGS
0.4/ 100
METRIC RATING
269th/ 347
METRIC RANK
$37,904
MEDIAN FEMALE EARNINGS
2.3/ 100
METRIC RATING
249th/ 347
METRIC RANK
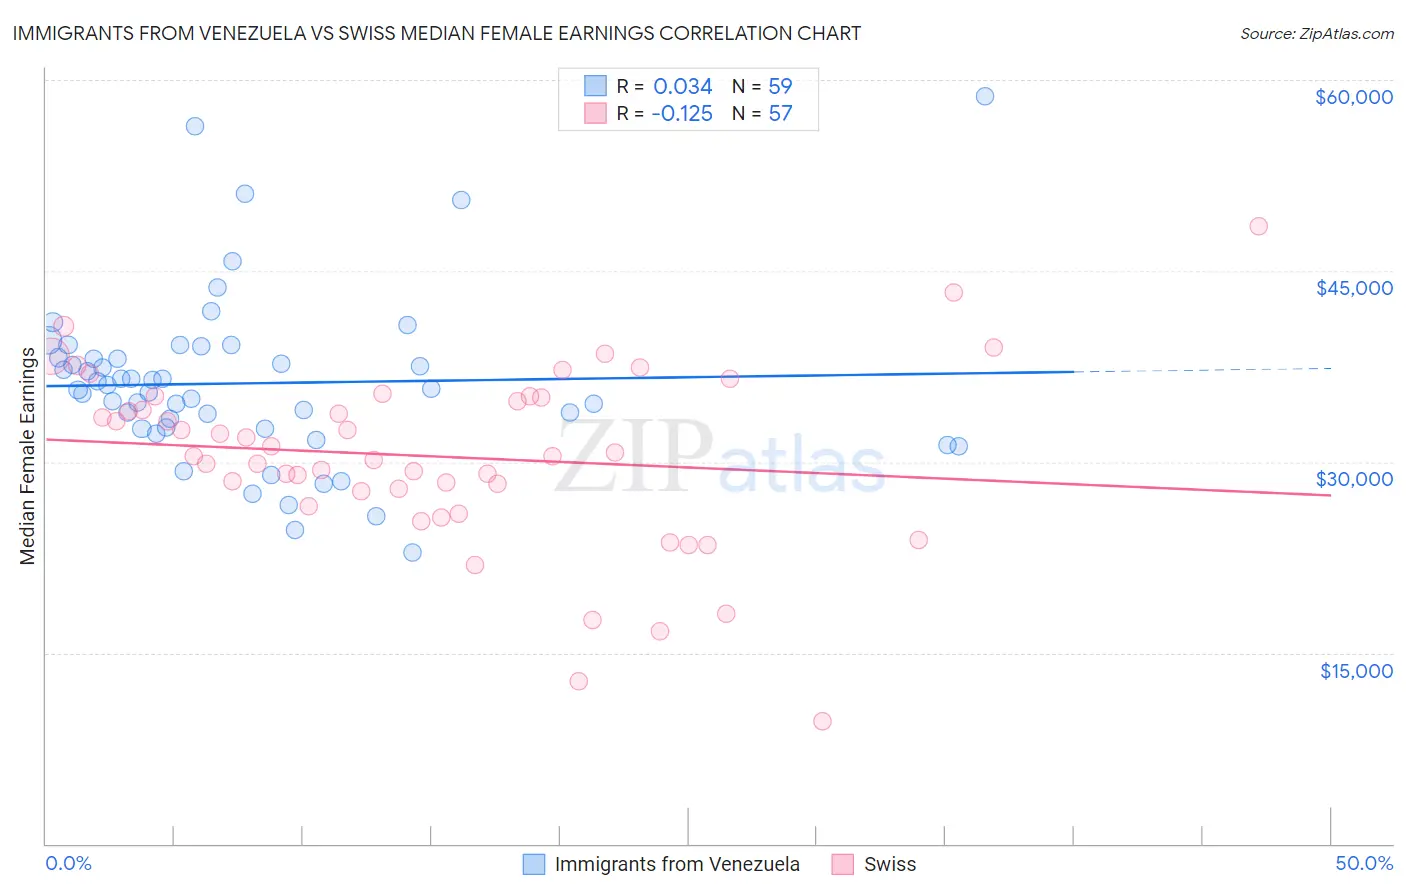
Immigrants from Venezuela vs Swiss Median Female Earnings Correlation Chart
The statistical analysis conducted on geographies consisting of 287,813,755 people shows no correlation between the proportion of Immigrants from Venezuela and median female earnings in the United States with a correlation coefficient (R) of 0.034 and weighted average of $37,003. Similarly, the statistical analysis conducted on geographies consisting of 464,484,716 people shows a poor negative correlation between the proportion of Swiss and median female earnings in the United States with a correlation coefficient (R) of -0.125 and weighted average of $37,904, a difference of 2.4%.
Median Female Earnings Correlation Summary
| Measurement | Immigrants from Venezuela | Swiss |
| Minimum | $22,864 | $9,649 |
| Maximum | $58,709 | $48,533 |
| Range | $35,845 | $38,884 |
| Mean | $36,176 | $30,422 |
| Median | $35,750 | $30,468 |
| Interquartile 25% (IQ1) | $32,617 | $27,075 |
| Interquartile 75% (IQ3) | $38,204 | $35,111 |
| Interquartile Range (IQR) | $5,588 | $8,036 |
| Standard Deviation (Sample) | $6,703 | $7,120 |
| Standard Deviation (Population) | $6,646 | $7,057 |
Demographics Similar to Immigrants from Venezuela and Swiss by Median Female Earnings
In terms of median female earnings, the demographic groups most similar to Immigrants from Venezuela are Cree ($37,018, a difference of 0.040%), Nonimmigrants ($37,024, a difference of 0.060%), Dominican ($37,046, a difference of 0.12%), Immigrants from Belize ($37,056, a difference of 0.14%), and Salvadoran ($37,083, a difference of 0.22%). Similarly, the demographic groups most similar to Swiss are Immigrants from Iraq ($37,864, a difference of 0.11%), Welsh ($37,856, a difference of 0.13%), Immigrants from Dominica ($37,825, a difference of 0.21%), Danish ($37,730, a difference of 0.46%), and White/Caucasian ($37,531, a difference of 0.99%).
| Demographics | Rating | Rank | Median Female Earnings |
| Swiss | 2.3 /100 | #249 | Tragic $37,904 |
| Immigrants | Iraq | 2.2 /100 | #250 | Tragic $37,864 |
| Welsh | 2.1 /100 | #251 | Tragic $37,856 |
| Immigrants | Dominica | 2.0 /100 | #252 | Tragic $37,825 |
| Danes | 1.6 /100 | #253 | Tragic $37,730 |
| Whites/Caucasians | 1.1 /100 | #254 | Tragic $37,531 |
| Colville | 1.1 /100 | #255 | Tragic $37,514 |
| Samoans | 1.0 /100 | #256 | Tragic $37,498 |
| Hawaiians | 1.0 /100 | #257 | Tragic $37,497 |
| Belizeans | 0.9 /100 | #258 | Tragic $37,429 |
| Scotch-Irish | 0.8 /100 | #259 | Tragic $37,383 |
| Dutch | 0.7 /100 | #260 | Tragic $37,339 |
| Malaysians | 0.7 /100 | #261 | Tragic $37,298 |
| Venezuelans | 0.7 /100 | #262 | Tragic $37,282 |
| German Russians | 0.5 /100 | #263 | Tragic $37,105 |
| Salvadorans | 0.4 /100 | #264 | Tragic $37,083 |
| Immigrants | Belize | 0.4 /100 | #265 | Tragic $37,056 |
| Dominicans | 0.4 /100 | #266 | Tragic $37,046 |
| Immigrants | Nonimmigrants | 0.4 /100 | #267 | Tragic $37,024 |
| Cree | 0.4 /100 | #268 | Tragic $37,018 |
| Immigrants | Venezuela | 0.4 /100 | #269 | Tragic $37,003 |