Vietnamese vs Immigrants from Sri Lanka Median Female Earnings
COMPARE
Vietnamese
Immigrants from Sri Lanka
Median Female Earnings
Median Female Earnings Comparison
Vietnamese
Immigrants from Sri Lanka
$40,377
MEDIAN FEMALE EARNINGS
80.4/ 100
METRIC RATING
147th/ 347
METRIC RANK
$44,161
MEDIAN FEMALE EARNINGS
100.0/ 100
METRIC RATING
35th/ 347
METRIC RANK
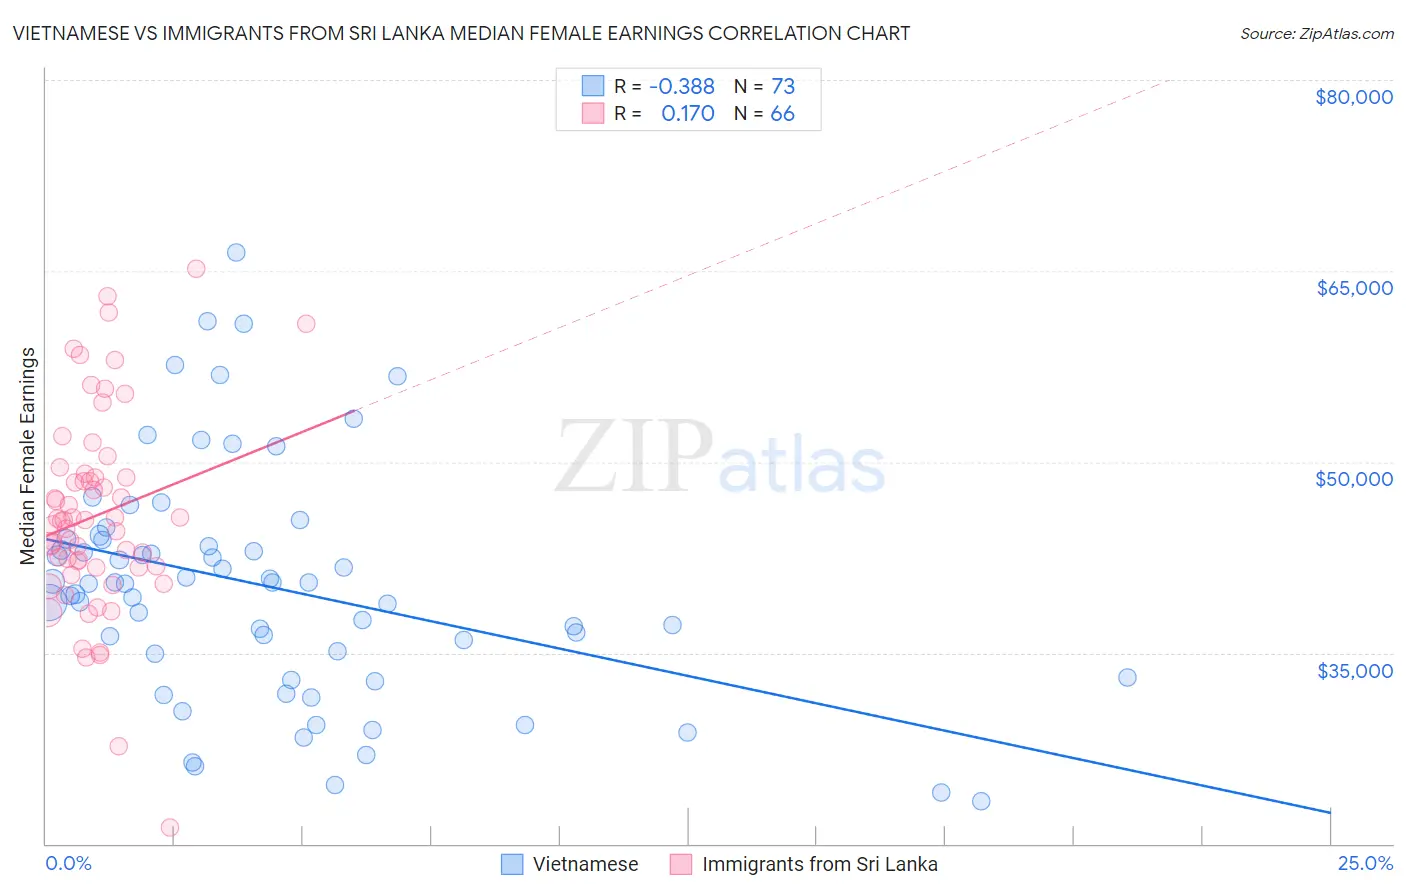
Vietnamese vs Immigrants from Sri Lanka Median Female Earnings Correlation Chart
The statistical analysis conducted on geographies consisting of 170,738,706 people shows a mild negative correlation between the proportion of Vietnamese and median female earnings in the United States with a correlation coefficient (R) of -0.388 and weighted average of $40,377. Similarly, the statistical analysis conducted on geographies consisting of 149,683,911 people shows a poor positive correlation between the proportion of Immigrants from Sri Lanka and median female earnings in the United States with a correlation coefficient (R) of 0.170 and weighted average of $44,161, a difference of 9.4%.
Median Female Earnings Correlation Summary
| Measurement | Vietnamese | Immigrants from Sri Lanka |
| Minimum | $23,385 | $21,250 |
| Maximum | $66,442 | $65,169 |
| Range | $43,057 | $43,919 |
| Mean | $40,184 | $45,787 |
| Median | $40,448 | $45,387 |
| Interquartile 25% (IQ1) | $34,018 | $41,731 |
| Interquartile 75% (IQ3) | $43,912 | $48,786 |
| Interquartile Range (IQR) | $9,894 | $7,055 |
| Standard Deviation (Sample) | $9,135 | $7,939 |
| Standard Deviation (Population) | $9,072 | $7,878 |
Similar Demographics by Median Female Earnings
Demographics Similar to Vietnamese by Median Female Earnings
In terms of median female earnings, the demographic groups most similar to Vietnamese are Polish ($40,371, a difference of 0.020%), Immigrants from Cameroon ($40,354, a difference of 0.060%), Immigrants from Chile ($40,353, a difference of 0.060%), Immigrants from Armenia ($40,340, a difference of 0.090%), and Ghanaian ($40,429, a difference of 0.13%).
| Demographics | Rating | Rank | Median Female Earnings |
| Serbians | 85.2 /100 | #140 | Excellent $40,539 |
| Immigrants | Syria | 84.1 /100 | #141 | Excellent $40,499 |
| Sri Lankans | 84.0 /100 | #142 | Excellent $40,496 |
| Northern Europeans | 83.9 /100 | #143 | Excellent $40,491 |
| Immigrants | North Macedonia | 83.8 /100 | #144 | Excellent $40,488 |
| Brazilians | 83.6 /100 | #145 | Excellent $40,483 |
| Ghanaians | 82.1 /100 | #146 | Excellent $40,429 |
| Vietnamese | 80.4 /100 | #147 | Excellent $40,377 |
| Poles | 80.2 /100 | #148 | Excellent $40,371 |
| Immigrants | Cameroon | 79.7 /100 | #149 | Good $40,354 |
| Immigrants | Chile | 79.6 /100 | #150 | Good $40,353 |
| Immigrants | Armenia | 79.2 /100 | #151 | Good $40,340 |
| West Indians | 78.4 /100 | #152 | Good $40,317 |
| British West Indians | 77.7 /100 | #153 | Good $40,299 |
| Immigrants | Oceania | 77.6 /100 | #154 | Good $40,297 |
Demographics Similar to Immigrants from Sri Lanka by Median Female Earnings
In terms of median female earnings, the demographic groups most similar to Immigrants from Sri Lanka are Russian ($44,169, a difference of 0.020%), Immigrants from Asia ($44,198, a difference of 0.080%), Immigrants from Turkey ($44,066, a difference of 0.21%), Immigrants from Switzerland ($43,996, a difference of 0.37%), and Immigrants from Northern Europe ($44,366, a difference of 0.46%).
| Demographics | Rating | Rank | Median Female Earnings |
| Immigrants | Russia | 100.0 /100 | #28 | Exceptional $44,680 |
| Immigrants | Belgium | 100.0 /100 | #29 | Exceptional $44,587 |
| Asians | 100.0 /100 | #30 | Exceptional $44,586 |
| Immigrants | France | 100.0 /100 | #31 | Exceptional $44,541 |
| Immigrants | Northern Europe | 100.0 /100 | #32 | Exceptional $44,366 |
| Immigrants | Asia | 100.0 /100 | #33 | Exceptional $44,198 |
| Russians | 100.0 /100 | #34 | Exceptional $44,169 |
| Immigrants | Sri Lanka | 100.0 /100 | #35 | Exceptional $44,161 |
| Immigrants | Turkey | 100.0 /100 | #36 | Exceptional $44,066 |
| Immigrants | Switzerland | 100.0 /100 | #37 | Exceptional $43,996 |
| Latvians | 100.0 /100 | #38 | Exceptional $43,941 |
| Israelis | 100.0 /100 | #39 | Exceptional $43,852 |
| Immigrants | Malaysia | 100.0 /100 | #40 | Exceptional $43,835 |
| Bhutanese | 100.0 /100 | #41 | Exceptional $43,648 |
| Immigrants | Denmark | 100.0 /100 | #42 | Exceptional $43,646 |