Indian (Asian) vs Immigrants from Sri Lanka Median Female Earnings
COMPARE
Indian (Asian)
Immigrants from Sri Lanka
Median Female Earnings
Median Female Earnings Comparison
Indians (Asian)
Immigrants from Sri Lanka
$46,481
MEDIAN FEMALE EARNINGS
100.0/ 100
METRIC RATING
16th/ 347
METRIC RANK
$44,161
MEDIAN FEMALE EARNINGS
100.0/ 100
METRIC RATING
35th/ 347
METRIC RANK
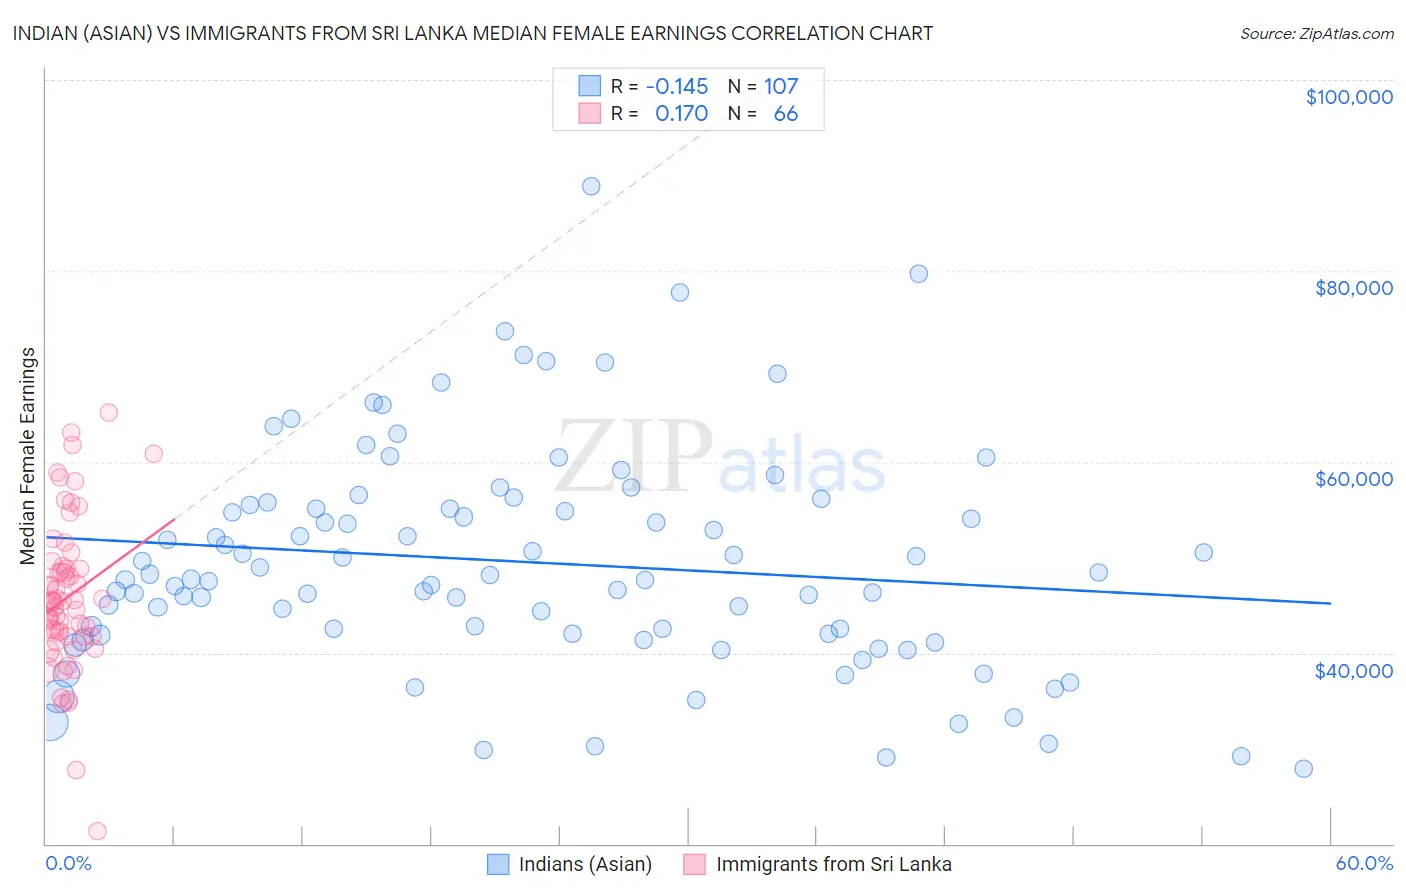
Indian (Asian) vs Immigrants from Sri Lanka Median Female Earnings Correlation Chart
The statistical analysis conducted on geographies consisting of 494,787,725 people shows a poor negative correlation between the proportion of Indians (Asian) and median female earnings in the United States with a correlation coefficient (R) of -0.145 and weighted average of $46,481. Similarly, the statistical analysis conducted on geographies consisting of 149,683,911 people shows a poor positive correlation between the proportion of Immigrants from Sri Lanka and median female earnings in the United States with a correlation coefficient (R) of 0.170 and weighted average of $44,161, a difference of 5.2%.
Median Female Earnings Correlation Summary
| Measurement | Indian (Asian) | Immigrants from Sri Lanka |
| Minimum | $27,791 | $21,250 |
| Maximum | $88,889 | $65,169 |
| Range | $61,098 | $43,919 |
| Mean | $49,511 | $45,787 |
| Median | $47,694 | $45,387 |
| Interquartile 25% (IQ1) | $42,024 | $41,731 |
| Interquartile 75% (IQ3) | $55,457 | $48,786 |
| Interquartile Range (IQR) | $13,433 | $7,055 |
| Standard Deviation (Sample) | $11,605 | $7,939 |
| Standard Deviation (Population) | $11,550 | $7,878 |
Demographics Similar to Indians (Asian) and Immigrants from Sri Lanka by Median Female Earnings
In terms of median female earnings, the demographic groups most similar to Indians (Asian) are Immigrants from Eastern Asia ($46,502, a difference of 0.050%), Immigrants from South Central Asia ($46,324, a difference of 0.34%), Cypriot ($45,570, a difference of 2.0%), Eastern European ($45,385, a difference of 2.4%), and Immigrants from Japan ($45,323, a difference of 2.6%). Similarly, the demographic groups most similar to Immigrants from Sri Lanka are Russian ($44,169, a difference of 0.020%), Immigrants from Asia ($44,198, a difference of 0.080%), Immigrants from Northern Europe ($44,366, a difference of 0.46%), Immigrants from France ($44,541, a difference of 0.86%), and Asian ($44,586, a difference of 0.96%).
| Demographics | Rating | Rank | Median Female Earnings |
| Immigrants | Eastern Asia | 100.0 /100 | #15 | Exceptional $46,502 |
| Indians (Asian) | 100.0 /100 | #16 | Exceptional $46,481 |
| Immigrants | South Central Asia | 100.0 /100 | #17 | Exceptional $46,324 |
| Cypriots | 100.0 /100 | #18 | Exceptional $45,570 |
| Eastern Europeans | 100.0 /100 | #19 | Exceptional $45,385 |
| Immigrants | Japan | 100.0 /100 | #20 | Exceptional $45,323 |
| Cambodians | 100.0 /100 | #21 | Exceptional $45,014 |
| Immigrants | Greece | 100.0 /100 | #22 | Exceptional $44,976 |
| Burmese | 100.0 /100 | #23 | Exceptional $44,911 |
| Immigrants | Korea | 100.0 /100 | #24 | Exceptional $44,847 |
| Immigrants | Sweden | 100.0 /100 | #25 | Exceptional $44,774 |
| Immigrants | Belarus | 100.0 /100 | #26 | Exceptional $44,757 |
| Turks | 100.0 /100 | #27 | Exceptional $44,695 |
| Immigrants | Russia | 100.0 /100 | #28 | Exceptional $44,680 |
| Immigrants | Belgium | 100.0 /100 | #29 | Exceptional $44,587 |
| Asians | 100.0 /100 | #30 | Exceptional $44,586 |
| Immigrants | France | 100.0 /100 | #31 | Exceptional $44,541 |
| Immigrants | Northern Europe | 100.0 /100 | #32 | Exceptional $44,366 |
| Immigrants | Asia | 100.0 /100 | #33 | Exceptional $44,198 |
| Russians | 100.0 /100 | #34 | Exceptional $44,169 |
| Immigrants | Sri Lanka | 100.0 /100 | #35 | Exceptional $44,161 |