Paiute vs Panamanian Median Household Income
COMPARE
Paiute
Panamanian
Median Household Income
Median Household Income Comparison
Paiute
Panamanians
$72,959
MEDIAN HOUSEHOLD INCOME
0.0/ 100
METRIC RATING
298th/ 347
METRIC RANK
$82,272
MEDIAN HOUSEHOLD INCOME
14.0/ 100
METRIC RATING
214th/ 347
METRIC RANK
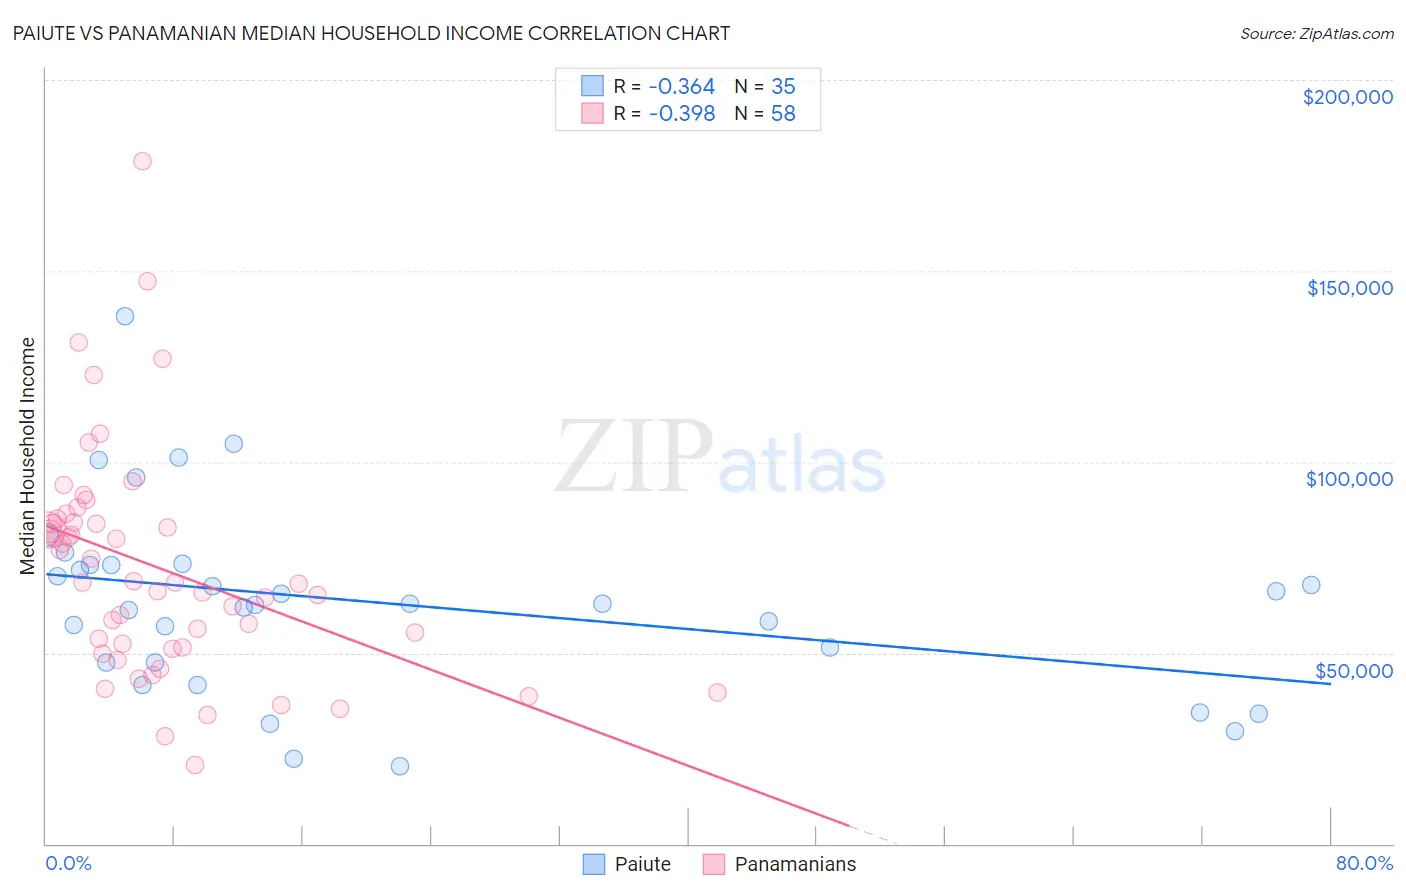
Paiute vs Panamanian Median Household Income Correlation Chart
The statistical analysis conducted on geographies consisting of 58,395,139 people shows a mild negative correlation between the proportion of Paiute and median household income in the United States with a correlation coefficient (R) of -0.364 and weighted average of $72,959. Similarly, the statistical analysis conducted on geographies consisting of 281,034,556 people shows a mild negative correlation between the proportion of Panamanians and median household income in the United States with a correlation coefficient (R) of -0.398 and weighted average of $82,272, a difference of 12.8%.
Median Household Income Correlation Summary
| Measurement | Paiute | Panamanian |
| Minimum | $20,139 | $20,556 |
| Maximum | $138,043 | $178,834 |
| Range | $117,904 | $158,278 |
| Mean | $63,163 | $72,362 |
| Median | $62,760 | $68,346 |
| Interquartile 25% (IQ1) | $47,361 | $51,530 |
| Interquartile 75% (IQ3) | $73,101 | $83,972 |
| Interquartile Range (IQR) | $25,740 | $32,442 |
| Standard Deviation (Sample) | $24,968 | $29,634 |
| Standard Deviation (Population) | $24,608 | $29,377 |
Similar Demographics by Median Household Income
Demographics Similar to Paiute by Median Household Income
In terms of median household income, the demographic groups most similar to Paiute are Indonesian ($72,856, a difference of 0.14%), Immigrants from Mexico ($73,160, a difference of 0.27%), Immigrants from Dominica ($72,760, a difference of 0.27%), Cherokee ($72,682, a difference of 0.38%), and Shoshone ($72,660, a difference of 0.41%).
| Demographics | Rating | Rank | Median Household Income |
| Hispanics or Latinos | 0.1 /100 | #291 | Tragic $73,823 |
| Comanche | 0.1 /100 | #292 | Tragic $73,747 |
| Immigrants | Cabo Verde | 0.1 /100 | #293 | Tragic $73,515 |
| Blackfeet | 0.1 /100 | #294 | Tragic $73,509 |
| Cubans | 0.1 /100 | #295 | Tragic $73,392 |
| Haitians | 0.1 /100 | #296 | Tragic $73,306 |
| Immigrants | Mexico | 0.0 /100 | #297 | Tragic $73,160 |
| Paiute | 0.0 /100 | #298 | Tragic $72,959 |
| Indonesians | 0.0 /100 | #299 | Tragic $72,856 |
| Immigrants | Dominica | 0.0 /100 | #300 | Tragic $72,760 |
| Cherokee | 0.0 /100 | #301 | Tragic $72,682 |
| Shoshone | 0.0 /100 | #302 | Tragic $72,660 |
| Africans | 0.0 /100 | #303 | Tragic $72,650 |
| Immigrants | Haiti | 0.0 /100 | #304 | Tragic $72,599 |
| Hondurans | 0.0 /100 | #305 | Tragic $72,588 |
Demographics Similar to Panamanians by Median Household Income
In terms of median household income, the demographic groups most similar to Panamanians are Vietnamese ($82,248, a difference of 0.030%), Yugoslavian ($82,186, a difference of 0.10%), Nepalese ($82,410, a difference of 0.17%), Venezuelan ($82,432, a difference of 0.20%), and Salvadoran ($82,449, a difference of 0.22%).
| Demographics | Rating | Rank | Median Household Income |
| Dutch | 20.3 /100 | #207 | Fair $82,971 |
| French Canadians | 18.7 /100 | #208 | Poor $82,810 |
| Immigrants | Iraq | 16.7 /100 | #209 | Poor $82,594 |
| Immigrants | Uruguay | 16.4 /100 | #210 | Poor $82,560 |
| Salvadorans | 15.4 /100 | #211 | Poor $82,449 |
| Venezuelans | 15.3 /100 | #212 | Poor $82,432 |
| Nepalese | 15.1 /100 | #213 | Poor $82,410 |
| Panamanians | 14.0 /100 | #214 | Poor $82,272 |
| Vietnamese | 13.8 /100 | #215 | Poor $82,248 |
| Yugoslavians | 13.3 /100 | #216 | Poor $82,186 |
| Ecuadorians | 12.5 /100 | #217 | Poor $82,070 |
| Whites/Caucasians | 12.2 /100 | #218 | Poor $82,029 |
| Nigerians | 10.3 /100 | #219 | Poor $81,725 |
| Immigrants | Venezuela | 9.0 /100 | #220 | Tragic $81,506 |
| Immigrants | Ghana | 9.0 /100 | #221 | Tragic $81,489 |