Paiute vs Chickasaw Median Household Income
COMPARE
Paiute
Chickasaw
Median Household Income
Median Household Income Comparison
Paiute
Chickasaw
$72,959
MEDIAN HOUSEHOLD INCOME
0.0/ 100
METRIC RATING
298th/ 347
METRIC RANK
$70,005
MEDIAN HOUSEHOLD INCOME
0.0/ 100
METRIC RATING
321st/ 347
METRIC RANK
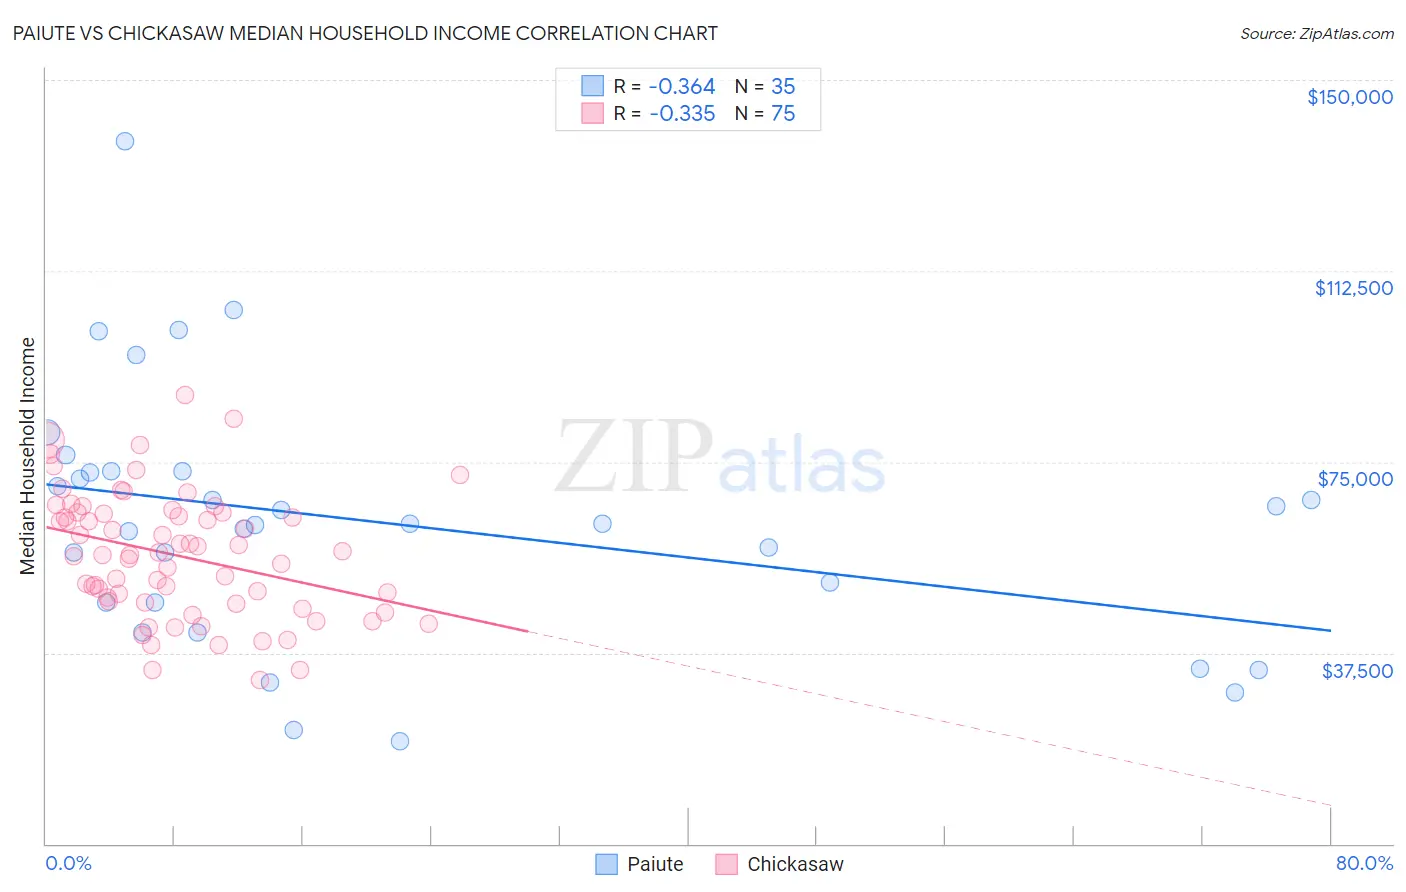
Paiute vs Chickasaw Median Household Income Correlation Chart
The statistical analysis conducted on geographies consisting of 58,395,139 people shows a mild negative correlation between the proportion of Paiute and median household income in the United States with a correlation coefficient (R) of -0.364 and weighted average of $72,959. Similarly, the statistical analysis conducted on geographies consisting of 147,666,315 people shows a mild negative correlation between the proportion of Chickasaw and median household income in the United States with a correlation coefficient (R) of -0.335 and weighted average of $70,005, a difference of 4.2%.
Median Household Income Correlation Summary
| Measurement | Paiute | Chickasaw |
| Minimum | $20,139 | $32,063 |
| Maximum | $138,043 | $88,105 |
| Range | $117,904 | $56,042 |
| Mean | $63,163 | $56,625 |
| Median | $62,760 | $56,725 |
| Interquartile 25% (IQ1) | $47,361 | $47,447 |
| Interquartile 75% (IQ3) | $73,101 | $65,033 |
| Interquartile Range (IQR) | $25,740 | $17,586 |
| Standard Deviation (Sample) | $24,968 | $12,174 |
| Standard Deviation (Population) | $24,608 | $12,093 |
Similar Demographics by Median Household Income
Demographics Similar to Paiute by Median Household Income
In terms of median household income, the demographic groups most similar to Paiute are Indonesian ($72,856, a difference of 0.14%), Immigrants from Mexico ($73,160, a difference of 0.27%), Immigrants from Dominica ($72,760, a difference of 0.27%), Cherokee ($72,682, a difference of 0.38%), and Shoshone ($72,660, a difference of 0.41%).
| Demographics | Rating | Rank | Median Household Income |
| Hispanics or Latinos | 0.1 /100 | #291 | Tragic $73,823 |
| Comanche | 0.1 /100 | #292 | Tragic $73,747 |
| Immigrants | Cabo Verde | 0.1 /100 | #293 | Tragic $73,515 |
| Blackfeet | 0.1 /100 | #294 | Tragic $73,509 |
| Cubans | 0.1 /100 | #295 | Tragic $73,392 |
| Haitians | 0.1 /100 | #296 | Tragic $73,306 |
| Immigrants | Mexico | 0.0 /100 | #297 | Tragic $73,160 |
| Paiute | 0.0 /100 | #298 | Tragic $72,959 |
| Indonesians | 0.0 /100 | #299 | Tragic $72,856 |
| Immigrants | Dominica | 0.0 /100 | #300 | Tragic $72,760 |
| Cherokee | 0.0 /100 | #301 | Tragic $72,682 |
| Shoshone | 0.0 /100 | #302 | Tragic $72,660 |
| Africans | 0.0 /100 | #303 | Tragic $72,650 |
| Immigrants | Haiti | 0.0 /100 | #304 | Tragic $72,599 |
| Hondurans | 0.0 /100 | #305 | Tragic $72,588 |
Demographics Similar to Chickasaw by Median Household Income
In terms of median household income, the demographic groups most similar to Chickasaw are Choctaw ($69,947, a difference of 0.080%), Colville ($70,094, a difference of 0.13%), Immigrants from Dominican Republic ($70,208, a difference of 0.29%), Bahamian ($69,726, a difference of 0.40%), and Yup'ik ($69,695, a difference of 0.45%).
| Demographics | Rating | Rank | Median Household Income |
| Dominicans | 0.0 /100 | #314 | Tragic $71,302 |
| Ottawa | 0.0 /100 | #315 | Tragic $70,984 |
| Apache | 0.0 /100 | #316 | Tragic $70,927 |
| Cajuns | 0.0 /100 | #317 | Tragic $70,605 |
| Chippewa | 0.0 /100 | #318 | Tragic $70,539 |
| Immigrants | Dominican Republic | 0.0 /100 | #319 | Tragic $70,208 |
| Colville | 0.0 /100 | #320 | Tragic $70,094 |
| Chickasaw | 0.0 /100 | #321 | Tragic $70,005 |
| Choctaw | 0.0 /100 | #322 | Tragic $69,947 |
| Bahamians | 0.0 /100 | #323 | Tragic $69,726 |
| Yup'ik | 0.0 /100 | #324 | Tragic $69,695 |
| Seminole | 0.0 /100 | #325 | Tragic $69,420 |
| Yuman | 0.0 /100 | #326 | Tragic $68,743 |
| Immigrants | Cuba | 0.0 /100 | #327 | Tragic $68,461 |
| Menominee | 0.0 /100 | #328 | Tragic $68,423 |