Paiute vs Immigrants from Central America Median Household Income
COMPARE
Paiute
Immigrants from Central America
Median Household Income
Median Household Income Comparison
Paiute
Immigrants from Central America
$72,959
MEDIAN HOUSEHOLD INCOME
0.0/ 100
METRIC RATING
298th/ 347
METRIC RANK
$74,217
MEDIAN HOUSEHOLD INCOME
0.1/ 100
METRIC RATING
288th/ 347
METRIC RANK
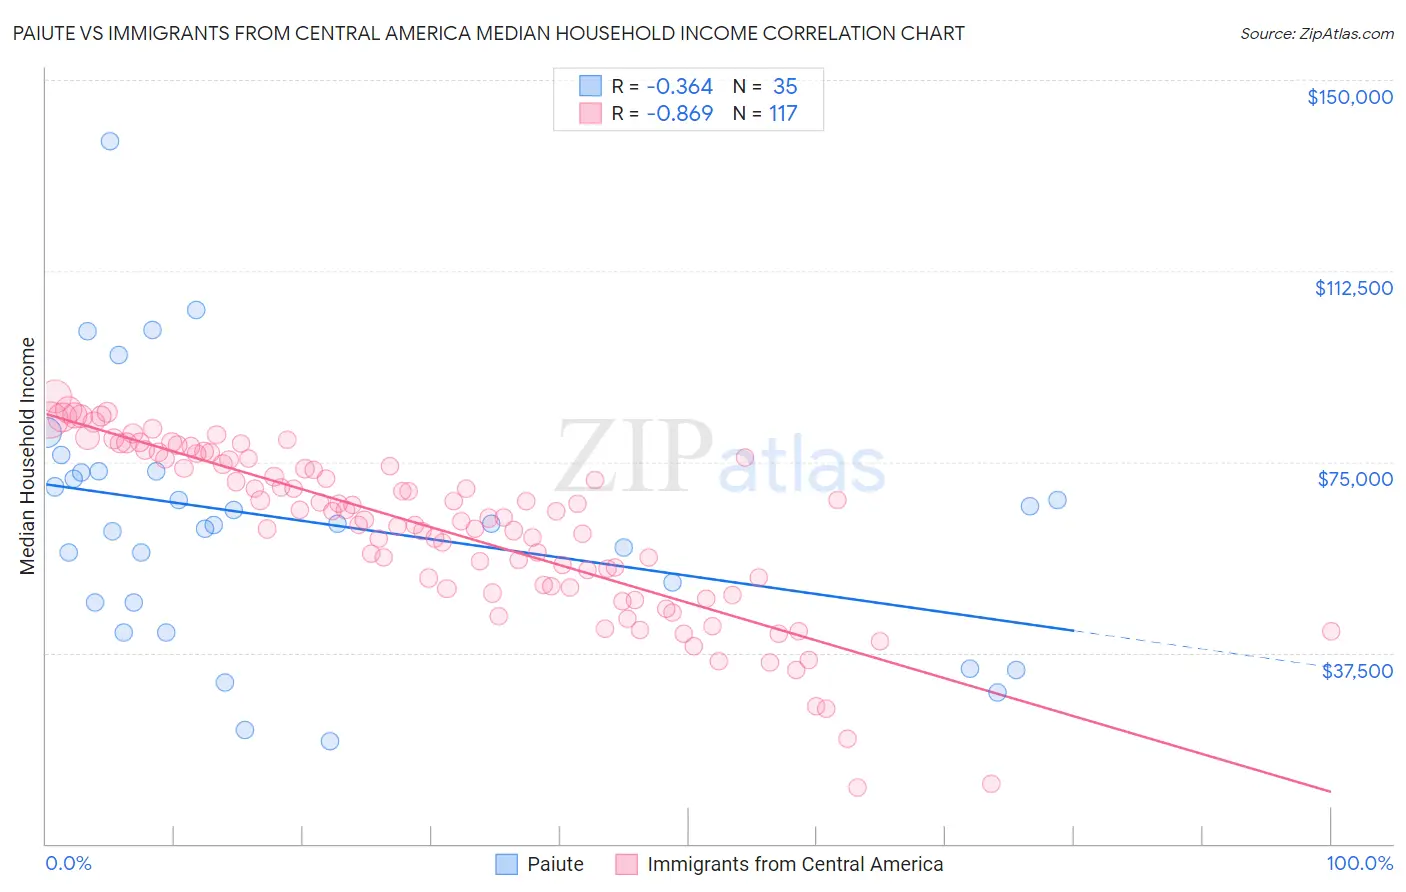
Paiute vs Immigrants from Central America Median Household Income Correlation Chart
The statistical analysis conducted on geographies consisting of 58,395,139 people shows a mild negative correlation between the proportion of Paiute and median household income in the United States with a correlation coefficient (R) of -0.364 and weighted average of $72,959. Similarly, the statistical analysis conducted on geographies consisting of 535,748,911 people shows a very strong negative correlation between the proportion of Immigrants from Central America and median household income in the United States with a correlation coefficient (R) of -0.869 and weighted average of $74,217, a difference of 1.7%.
Median Household Income Correlation Summary
| Measurement | Paiute | Immigrants from Central America |
| Minimum | $20,139 | $11,125 |
| Maximum | $138,043 | $87,880 |
| Range | $117,904 | $76,755 |
| Mean | $63,163 | $61,825 |
| Median | $62,760 | $64,116 |
| Interquartile 25% (IQ1) | $47,361 | $50,458 |
| Interquartile 75% (IQ3) | $73,101 | $75,695 |
| Interquartile Range (IQR) | $25,740 | $25,237 |
| Standard Deviation (Sample) | $24,968 | $16,428 |
| Standard Deviation (Population) | $24,608 | $16,358 |
Demographics Similar to Paiute and Immigrants from Central America by Median Household Income
In terms of median household income, the demographic groups most similar to Paiute are Indonesian ($72,856, a difference of 0.14%), Immigrants from Mexico ($73,160, a difference of 0.27%), Immigrants from Dominica ($72,760, a difference of 0.27%), Cherokee ($72,682, a difference of 0.38%), and Shoshone ($72,660, a difference of 0.41%). Similarly, the demographic groups most similar to Immigrants from Central America are Fijian ($74,205, a difference of 0.020%), Iroquois ($74,279, a difference of 0.080%), Immigrants from Somalia ($74,300, a difference of 0.11%), Bangladeshi ($74,112, a difference of 0.14%), and Mexican ($74,399, a difference of 0.24%).
| Demographics | Rating | Rank | Median Household Income |
| Cree | 0.1 /100 | #283 | Tragic $74,685 |
| Yaqui | 0.1 /100 | #284 | Tragic $74,596 |
| Mexicans | 0.1 /100 | #285 | Tragic $74,399 |
| Immigrants | Somalia | 0.1 /100 | #286 | Tragic $74,300 |
| Iroquois | 0.1 /100 | #287 | Tragic $74,279 |
| Immigrants | Central America | 0.1 /100 | #288 | Tragic $74,217 |
| Fijians | 0.1 /100 | #289 | Tragic $74,205 |
| Bangladeshis | 0.1 /100 | #290 | Tragic $74,112 |
| Hispanics or Latinos | 0.1 /100 | #291 | Tragic $73,823 |
| Comanche | 0.1 /100 | #292 | Tragic $73,747 |
| Immigrants | Cabo Verde | 0.1 /100 | #293 | Tragic $73,515 |
| Blackfeet | 0.1 /100 | #294 | Tragic $73,509 |
| Cubans | 0.1 /100 | #295 | Tragic $73,392 |
| Haitians | 0.1 /100 | #296 | Tragic $73,306 |
| Immigrants | Mexico | 0.0 /100 | #297 | Tragic $73,160 |
| Paiute | 0.0 /100 | #298 | Tragic $72,959 |
| Indonesians | 0.0 /100 | #299 | Tragic $72,856 |
| Immigrants | Dominica | 0.0 /100 | #300 | Tragic $72,760 |
| Cherokee | 0.0 /100 | #301 | Tragic $72,682 |
| Shoshone | 0.0 /100 | #302 | Tragic $72,660 |
| Africans | 0.0 /100 | #303 | Tragic $72,650 |