Paiute vs Menominee Median Household Income
COMPARE
Paiute
Menominee
Median Household Income
Median Household Income Comparison
Paiute
Menominee
$72,959
MEDIAN HOUSEHOLD INCOME
0.0/ 100
METRIC RATING
298th/ 347
METRIC RANK
$68,423
MEDIAN HOUSEHOLD INCOME
0.0/ 100
METRIC RATING
328th/ 347
METRIC RANK
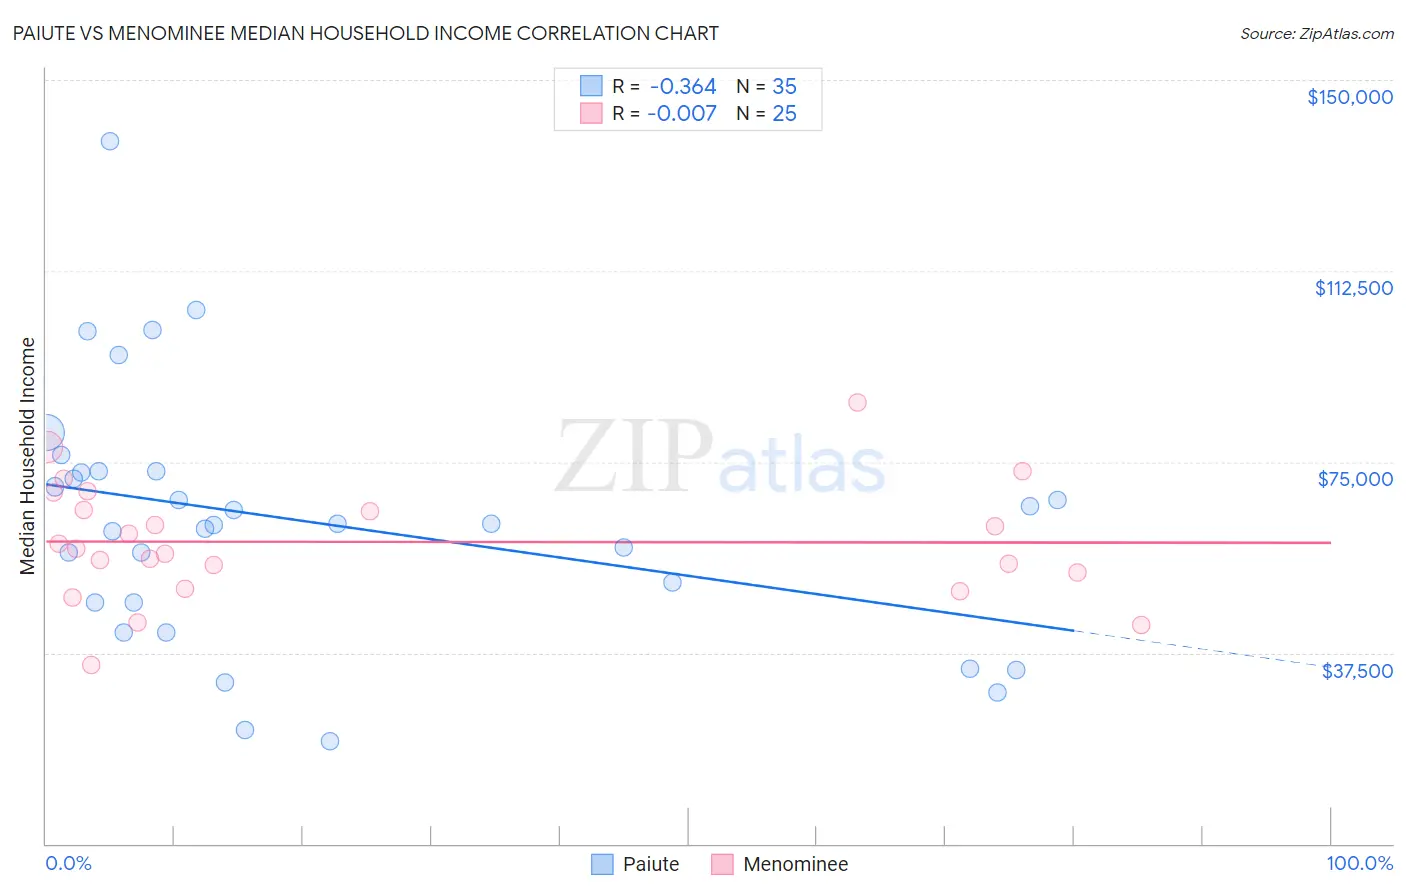
Paiute vs Menominee Median Household Income Correlation Chart
The statistical analysis conducted on geographies consisting of 58,395,139 people shows a mild negative correlation between the proportion of Paiute and median household income in the United States with a correlation coefficient (R) of -0.364 and weighted average of $72,959. Similarly, the statistical analysis conducted on geographies consisting of 45,776,591 people shows no correlation between the proportion of Menominee and median household income in the United States with a correlation coefficient (R) of -0.007 and weighted average of $68,423, a difference of 6.6%.
Median Household Income Correlation Summary
| Measurement | Paiute | Menominee |
| Minimum | $20,139 | $35,112 |
| Maximum | $138,043 | $86,563 |
| Range | $117,904 | $51,451 |
| Mean | $63,163 | $59,292 |
| Median | $62,760 | $57,897 |
| Interquartile 25% (IQ1) | $47,361 | $51,640 |
| Interquartile 75% (IQ3) | $73,101 | $67,237 |
| Interquartile Range (IQR) | $25,740 | $15,596 |
| Standard Deviation (Sample) | $24,968 | $11,591 |
| Standard Deviation (Population) | $24,608 | $11,357 |
Similar Demographics by Median Household Income
Demographics Similar to Paiute by Median Household Income
In terms of median household income, the demographic groups most similar to Paiute are Indonesian ($72,856, a difference of 0.14%), Immigrants from Mexico ($73,160, a difference of 0.27%), Immigrants from Dominica ($72,760, a difference of 0.27%), Cherokee ($72,682, a difference of 0.38%), and Shoshone ($72,660, a difference of 0.41%).
| Demographics | Rating | Rank | Median Household Income |
| Hispanics or Latinos | 0.1 /100 | #291 | Tragic $73,823 |
| Comanche | 0.1 /100 | #292 | Tragic $73,747 |
| Immigrants | Cabo Verde | 0.1 /100 | #293 | Tragic $73,515 |
| Blackfeet | 0.1 /100 | #294 | Tragic $73,509 |
| Cubans | 0.1 /100 | #295 | Tragic $73,392 |
| Haitians | 0.1 /100 | #296 | Tragic $73,306 |
| Immigrants | Mexico | 0.0 /100 | #297 | Tragic $73,160 |
| Paiute | 0.0 /100 | #298 | Tragic $72,959 |
| Indonesians | 0.0 /100 | #299 | Tragic $72,856 |
| Immigrants | Dominica | 0.0 /100 | #300 | Tragic $72,760 |
| Cherokee | 0.0 /100 | #301 | Tragic $72,682 |
| Shoshone | 0.0 /100 | #302 | Tragic $72,660 |
| Africans | 0.0 /100 | #303 | Tragic $72,650 |
| Immigrants | Haiti | 0.0 /100 | #304 | Tragic $72,599 |
| Hondurans | 0.0 /100 | #305 | Tragic $72,588 |
Demographics Similar to Menominee by Median Household Income
In terms of median household income, the demographic groups most similar to Menominee are Dutch West Indian ($68,412, a difference of 0.020%), Immigrants from Cuba ($68,461, a difference of 0.060%), Yuman ($68,743, a difference of 0.47%), Arapaho ($67,965, a difference of 0.67%), and Native/Alaskan ($67,879, a difference of 0.80%).
| Demographics | Rating | Rank | Median Household Income |
| Chickasaw | 0.0 /100 | #321 | Tragic $70,005 |
| Choctaw | 0.0 /100 | #322 | Tragic $69,947 |
| Bahamians | 0.0 /100 | #323 | Tragic $69,726 |
| Yup'ik | 0.0 /100 | #324 | Tragic $69,695 |
| Seminole | 0.0 /100 | #325 | Tragic $69,420 |
| Yuman | 0.0 /100 | #326 | Tragic $68,743 |
| Immigrants | Cuba | 0.0 /100 | #327 | Tragic $68,461 |
| Menominee | 0.0 /100 | #328 | Tragic $68,423 |
| Dutch West Indians | 0.0 /100 | #329 | Tragic $68,412 |
| Arapaho | 0.0 /100 | #330 | Tragic $67,965 |
| Natives/Alaskans | 0.0 /100 | #331 | Tragic $67,879 |
| Sioux | 0.0 /100 | #332 | Tragic $67,792 |
| Creek | 0.0 /100 | #333 | Tragic $67,715 |
| Blacks/African Americans | 0.0 /100 | #334 | Tragic $67,573 |
| Cheyenne | 0.0 /100 | #335 | Tragic $66,974 |