Immigrants from South Central Asia vs Chickasaw Median Household Income
COMPARE
Immigrants from South Central Asia
Chickasaw
Median Household Income
Median Household Income Comparison
Immigrants from South Central Asia
Chickasaw
$106,057
MEDIAN HOUSEHOLD INCOME
100.0/ 100
METRIC RATING
10th/ 347
METRIC RANK
$70,005
MEDIAN HOUSEHOLD INCOME
0.0/ 100
METRIC RATING
321st/ 347
METRIC RANK
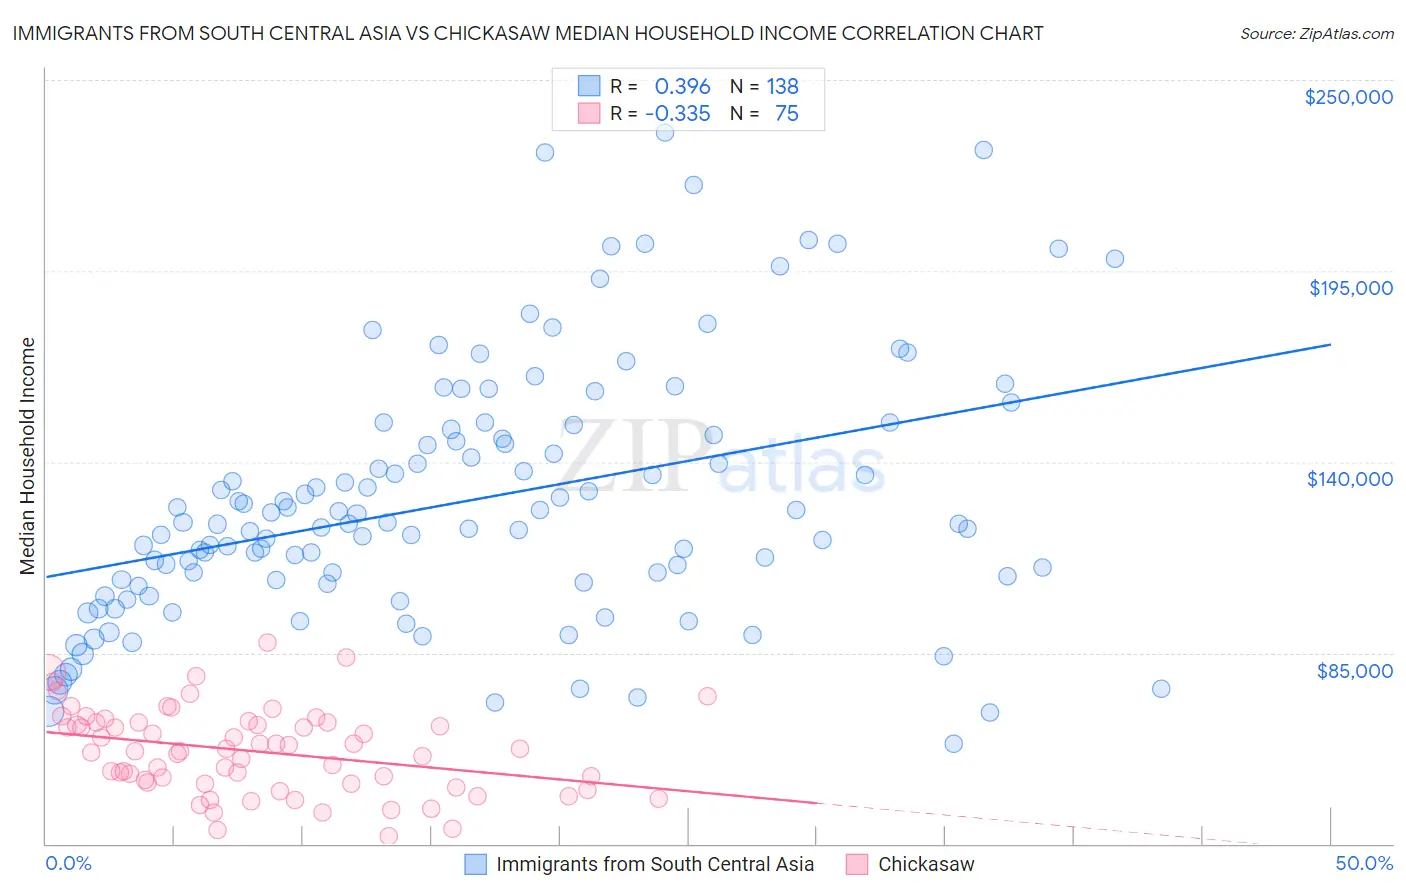
Immigrants from South Central Asia vs Chickasaw Median Household Income Correlation Chart
The statistical analysis conducted on geographies consisting of 472,541,565 people shows a mild positive correlation between the proportion of Immigrants from South Central Asia and median household income in the United States with a correlation coefficient (R) of 0.396 and weighted average of $106,057. Similarly, the statistical analysis conducted on geographies consisting of 147,666,315 people shows a mild negative correlation between the proportion of Chickasaw and median household income in the United States with a correlation coefficient (R) of -0.335 and weighted average of $70,005, a difference of 51.5%.
Median Household Income Correlation Summary
| Measurement | Immigrants from South Central Asia | Chickasaw |
| Minimum | $58,750 | $32,063 |
| Maximum | $234,750 | $88,105 |
| Range | $176,000 | $56,042 |
| Mean | $128,797 | $56,625 |
| Median | $122,210 | $56,725 |
| Interquartile 25% (IQ1) | $105,243 | $47,447 |
| Interquartile 75% (IQ3) | $147,699 | $65,033 |
| Interquartile Range (IQR) | $42,456 | $17,586 |
| Standard Deviation (Sample) | $36,764 | $12,174 |
| Standard Deviation (Population) | $36,630 | $12,093 |
Similar Demographics by Median Household Income
Demographics Similar to Immigrants from South Central Asia by Median Household Income
In terms of median household income, the demographic groups most similar to Immigrants from South Central Asia are Okinawan ($106,624, a difference of 0.53%), Immigrants from China ($105,335, a difference of 0.69%), Indian (Asian) ($105,262, a difference of 0.76%), Immigrants from Eastern Asia ($104,796, a difference of 1.2%), and Immigrants from Ireland ($104,692, a difference of 1.3%).
| Demographics | Rating | Rank | Median Household Income |
| Immigrants | India | 100.0 /100 | #3 | Exceptional $113,009 |
| Immigrants | Hong Kong | 100.0 /100 | #4 | Exceptional $111,519 |
| Thais | 100.0 /100 | #5 | Exceptional $110,648 |
| Immigrants | Singapore | 100.0 /100 | #6 | Exceptional $110,428 |
| Iranians | 100.0 /100 | #7 | Exceptional $109,835 |
| Immigrants | Iran | 100.0 /100 | #8 | Exceptional $108,055 |
| Okinawans | 100.0 /100 | #9 | Exceptional $106,624 |
| Immigrants | South Central Asia | 100.0 /100 | #10 | Exceptional $106,057 |
| Immigrants | China | 100.0 /100 | #11 | Exceptional $105,335 |
| Indians (Asian) | 100.0 /100 | #12 | Exceptional $105,262 |
| Immigrants | Eastern Asia | 100.0 /100 | #13 | Exceptional $104,796 |
| Immigrants | Ireland | 100.0 /100 | #14 | Exceptional $104,692 |
| Immigrants | Israel | 100.0 /100 | #15 | Exceptional $104,090 |
| Burmese | 100.0 /100 | #16 | Exceptional $103,145 |
| Immigrants | Korea | 100.0 /100 | #17 | Exceptional $102,962 |
Demographics Similar to Chickasaw by Median Household Income
In terms of median household income, the demographic groups most similar to Chickasaw are Choctaw ($69,947, a difference of 0.080%), Colville ($70,094, a difference of 0.13%), Immigrants from Dominican Republic ($70,208, a difference of 0.29%), Bahamian ($69,726, a difference of 0.40%), and Yup'ik ($69,695, a difference of 0.45%).
| Demographics | Rating | Rank | Median Household Income |
| Dominicans | 0.0 /100 | #314 | Tragic $71,302 |
| Ottawa | 0.0 /100 | #315 | Tragic $70,984 |
| Apache | 0.0 /100 | #316 | Tragic $70,927 |
| Cajuns | 0.0 /100 | #317 | Tragic $70,605 |
| Chippewa | 0.0 /100 | #318 | Tragic $70,539 |
| Immigrants | Dominican Republic | 0.0 /100 | #319 | Tragic $70,208 |
| Colville | 0.0 /100 | #320 | Tragic $70,094 |
| Chickasaw | 0.0 /100 | #321 | Tragic $70,005 |
| Choctaw | 0.0 /100 | #322 | Tragic $69,947 |
| Bahamians | 0.0 /100 | #323 | Tragic $69,726 |
| Yup'ik | 0.0 /100 | #324 | Tragic $69,695 |
| Seminole | 0.0 /100 | #325 | Tragic $69,420 |
| Yuman | 0.0 /100 | #326 | Tragic $68,743 |
| Immigrants | Cuba | 0.0 /100 | #327 | Tragic $68,461 |
| Menominee | 0.0 /100 | #328 | Tragic $68,423 |